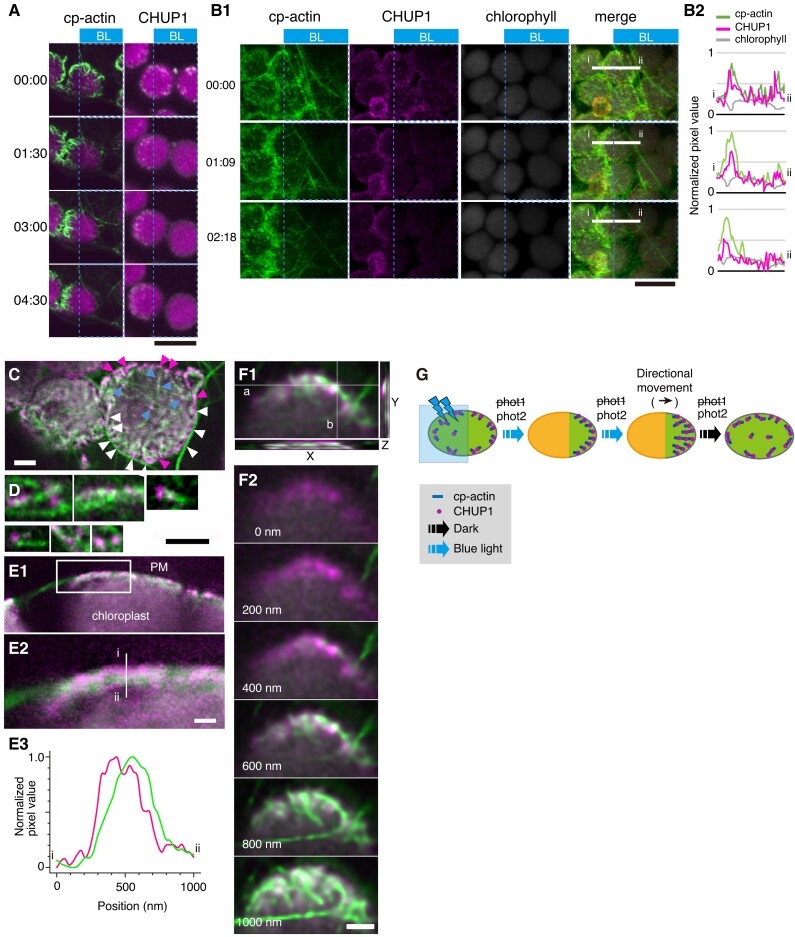
Figure 3.
Association of CHUP1 with cp-actin filaments. A) Asymmetric distribution of cp-actin filaments (green color, left panels) and CHUP1 (white color right panels) on moving chloroplasts. Time-lapse images were collected at 30-s intervals for 4 min 30 s under strong blue light irradiation at the blue rectangle ROI using 458-nm laser scans (output power of 2.8 μW) in the intervals between image acquisitions. Image acquisition time stamps (min:s) are shown. Fluorescence images were captured at a resolution of 512 × 512 pixels using a 4× digital zoom in GFP-mTalin and CHUP1-YFP transgenic plants, respectively. The fluorescent images show cp-actin (green) or CHUP1 (white) merged with chlorophyll (magenta). The time (min:s) of image acquisition is shown on the left. Scale bar, 10 μm. B) Reorganization of CHUP1 and cp-actin filaments on moving chloroplasts in a CHUP1-tdTomato GFP-mTalin line. Time-lapse images were collected at the indicated time points (min:s). The other details are the same as in A) except that images were acquired at 34-s intervals for 3 min 27 s. Scale bar, 10 µm. A time-lapse movie of this response is shown in Supplementary Movie S7. B1) fluorescence images show cp-actin filaments (cp-actin, green), CHUP1-tdTomato (CHUP1, magenta), chloroplast (chlorophyll, gray), and the merged image of cp-actin filaments, CHUP1, and chlorophyll (merge). B2) fluorescence intensity profiles of CHUP1-tdTomato (magenta) and cp-actin filaments (green) along the white line (i and ii) in B1) (merge). C) Top view of chloroplasts facing the plasma membrane of the periclinal wall of palisade cells. Cp-actin filaments, CHUP1, and chloroplasts are shown with fluorescent images obtained from GFP-mTalin (green), CHUP1-tdTomato (magenta), and chlorophyll (gray), respectively, in a CHUP1-tdTomato GFP-mTalin line. Notably, CHUP1 was predominantly found in the peripheral region of chloroplast (magenta arrowheads). White arrowheads indicate CHUP1 attached to long cytoplasmic actin filaments. Blue arrowheads indicate CHUP1 localized at the tips or along the sides of cp-actin filaments. D) Magnified views of CHUP1 localized close to cp-actin filaments. E) Distribution of CHUP1 and cp-actin filaments within the region between the plasma membrane and the chloroplast envelope. CHUP1 localized to the plasma membrane side and cp-actin filaments along the chloroplast side. E1) An optical slice of a side view of a chloroplast next to the plasma membrane along an anticlinal wall. E2) An enlarged image of the area within the rectangle in E1). E3) Fluorescence intensity profiles of CHUP1-tdTomato (magenta) and cp-actin filaments (green) along the white line (i and ii) in E2) from the plasma membrane side (i, top of the line) to the chloroplast side (ii, bottom of the line). F) Separate distributions of CHUP1 at the plasma membrane side and cp-actin filaments on the chloroplast side. Top views of part of a chloroplast are shown. F1) A Z-series of 6 confocal images of fluorescence of CHUP1-tdTomato (magenta) and GFP-mTalin (green) taken with 200-nm steps from the plasma membrane side to the chloroplast side and superimposed on an X–Y plane using the maximum intensity projection method. In the X–Z plane at white line a and the Y–Z plane at white line b, the CHUP1-tdTomato and GFP-mTalin fluorescence for the entire Z-series was compiled, confirming that CHUP1 is on the plasma membrane side and cp-actin filaments are on the chloroplast side. The individual images are shown in F2). Scale bars, 1 μm in C, D, and F), and 500 nm in E). G) Diagram illustrating the coordinated phototropin-dependent dynamics of CHUP1 and cp-actin filaments. Clusters of CHUP1 (magenta dots) closely localize with cp-actin filaments. Asymmetric redistribution of CHUP1 and cp-actin filaments is coordinately regulated by phototropin in response to irradiation of part of a chloroplast with strong blue light (blue rectangle). phot2 is the main photoreceptor regulating the strong light-induced avoidance response.

