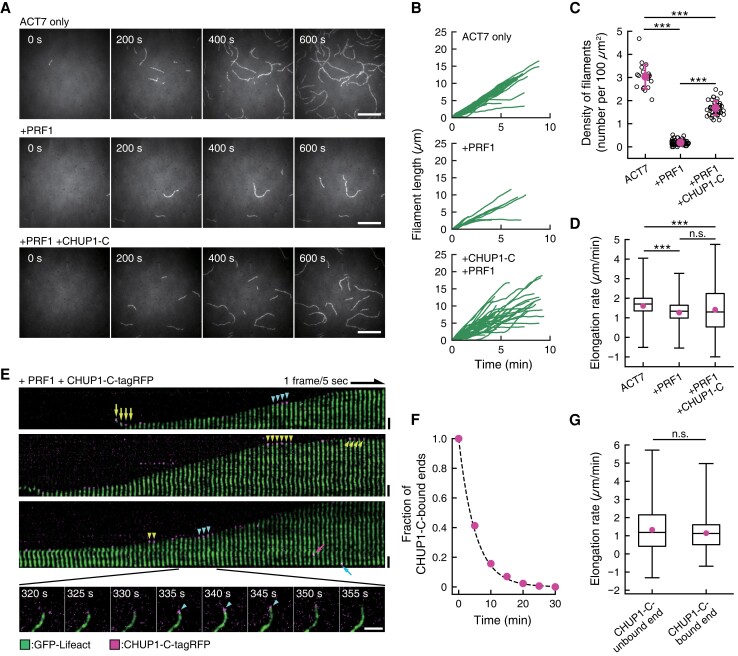
Figure 6.
CHUP1-C-dependent polymerization of ACT7 filaments from ACT7–profilin complexes. A) Nucleation and elongation of ACT7 filaments. Monomeric ACT7 at 1.5 μM was allowed to polymerize in F-buffer 2 containing 0.3% (w/v) methylcellulose, 2 mM Trolox, and 0.25 μM GFP-Lifeact (E17K) in a chamber. Prior incubation of ACT7 with a 2-fold molar excess of profilin PRF1 strongly inhibited spontaneous nucleation (middle row). However, the addition of 0.5 µM CHUP1-C-tagRFP partially reversed the effects of PRF1 and allowed nucleation and polymerization of a large number of filaments (bottom row). Scale bars, 10 µm. B) Polymerization kinetics of individual filaments under the 3 conditions in A). C) Quantification of nucleation activities of ACT7 under the 3 conditions in A). Numbers of ACT7 filaments were counted at about 10 min after the induction of polymerization. The means of the densities (the numbers of filaments per 100 µm2) were 3.04 ± 0.54/100 µm2 for ACT7 only (21 ROIs from 2 chambers), 0.19 ± 0.11/100 µm2 for +PRF1 (68 ROIs from 3 chambers) and 1.68 ± 0.31/100 µm2 for +PRF1 +CHUP1-C (40 ROIs from 3 chambers). ***P < 0.001 (Mann–Whitney U-test). D) Boxplot showing the elongation rates during 10-s intervals. The box represents the 25 to 75th percentiles, and the median is indicated by the black line. The whiskers show the complete range from minimum to maximum values. Means (represented by red circle) ± standard deviation (Sd) and the numbers of samples were 1.61 ± 0.61 µm/min for ACT7 only (1,235 intervals of 44 filaments from 2 chambers), 1.27 ± 0.62 µm/min for +PRF1 (347 intervals of 15 filaments from 3 chambers) and 1.41 ± 1.08 µm/min for +PRF1 +CHUP1-C (1,482 intervals of 47 filaments from 3 chambers). ***P < 0.001 (Mann–Whitney U-test). E) Kymographic representation of polymerization of an ACT7 filament in the presence of PRF1 and CHUP1-C-tagRFP. Green shows fluorescence of GFP-Lifeact (E17K), and magenta shows that of CHUP1-C-tagRFP. Raw fluorescence images of a polymerizing ACT7 filament (shown in the bottom row) were straightened and aligned to assemble a kymograph after the background was subtracted using ImageJ software. Spots of CHUP1-C-tagRFP were observed both during the growing phases (cyan arrowheads) and the stationary phases (yellow arrowheads) at the ACT7 filament ends. CHUP1-C-tagRFP spots were also sometimes observed at the end of short ACT7 filaments (yellow arrows), which presumably represent complexes of CHUP1-C-tagRFP and actin filaments at the initial phase of polymerization. Binding to the filament side (magenta arrow) and the less active end (cyan arrow) was also observed, but these frequencies were much lower than that of active-end binding (Supplementary Fig. S7, B and C). Scale bars, 2 µm. F) Dwell time of CHUP1-C-tagRFP at active ends of the filaments. Time-lapse images taken at 5-s intervals were analyzed, and the minimum lifetime of each fluorescent spot were cumulated and plotted (red circles). The dashed line is the exponential fit yielding the dissociation rate of CHUP1-C-tagRFP from the elongating end koff = 0.19 s−1. G) Comparison of the elongation rates between CHUP1-C-unbound ends and CHUP1-C-bound ends. Boxplot shows the elongation rates during 5-s interval of 36 filaments to which CHUP1-C-tagRFP was transiently bound (from 3 chambers), analyzed separately for CHUP1-C-tagRFP-bound phases and unbound phases. The box represents the 25 to 75th percentiles, and the median is indicated by the black line. The whiskers show the complete range from minimum to maximum values. Means (represented by red circle) ± Sd and the numbers of samples were 1.32 ± 1.14 µm/min for unbound ends (2,437 intervals) and 1.14 ± 0.85 µm/min (274 intervals). P = 0.053 (Mann–Whitney U-test).

