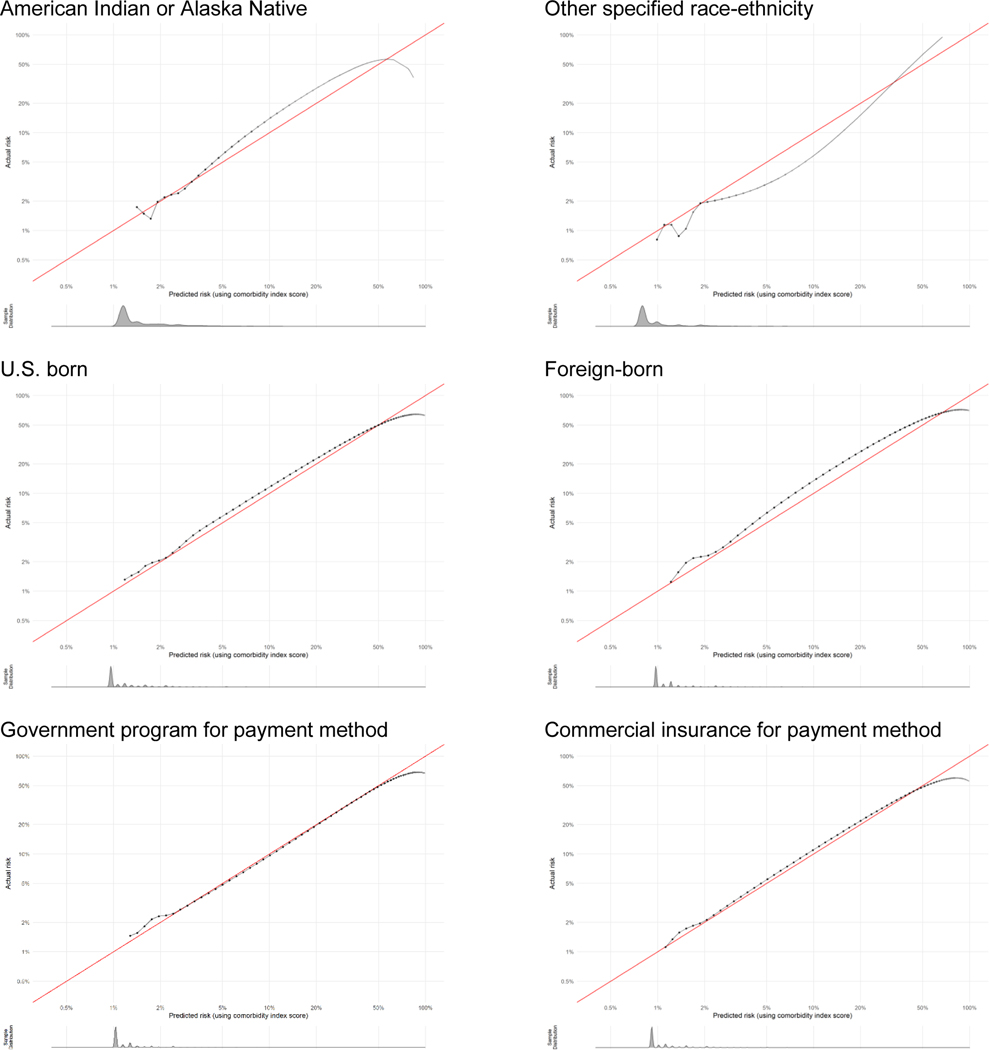
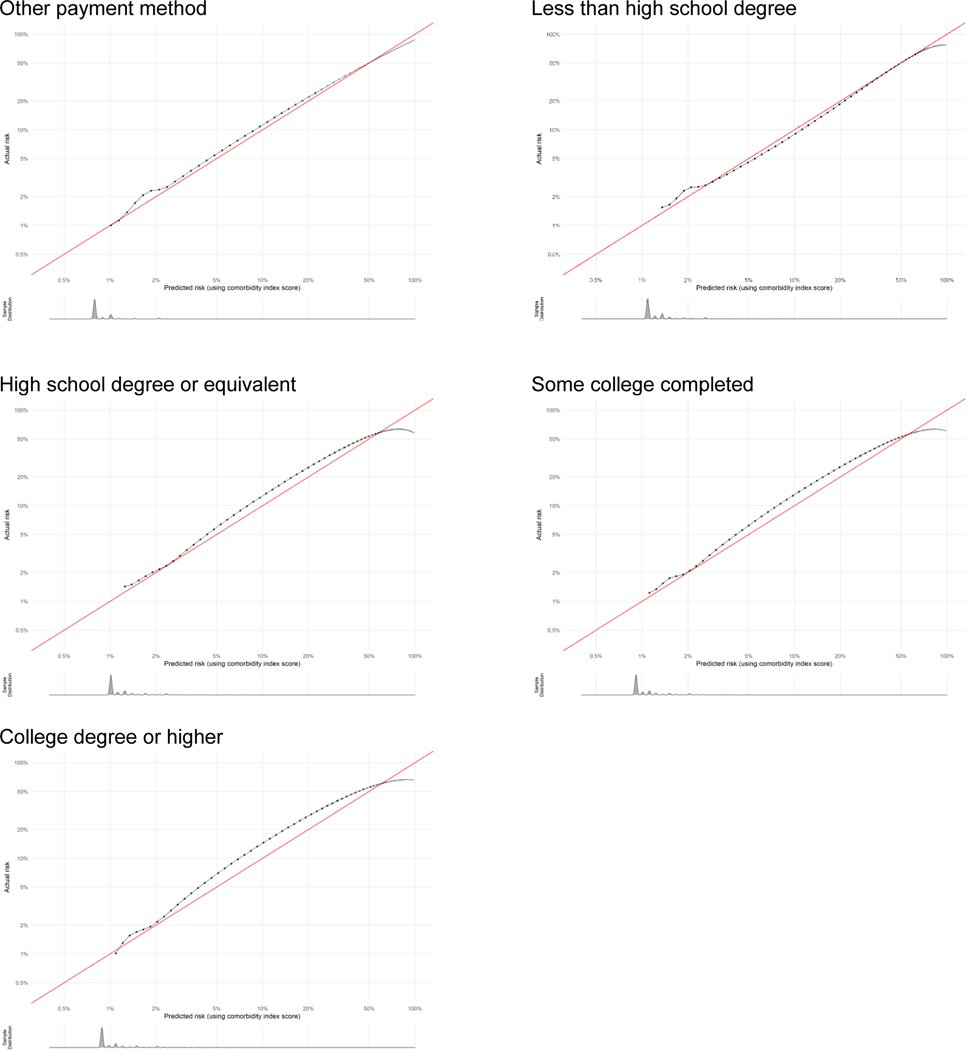
Appendix 2. Calibration plots for severe maternal morbidity comorbidity scores by subpopulation as indicator of goodness of fit.
Calibration plots show how well the score predicts the absolute risk of the outcome. Data presented are log-transformed and histograms are shown beneath each calibration plot for distributions of predicted risk. Calibration is excellent in nearly all groups, with the notable exception of when sample size becomes very small (i.e., American Indian-Alaska Native, other race-ethnicity, other payment method, and at very high risk levels).


