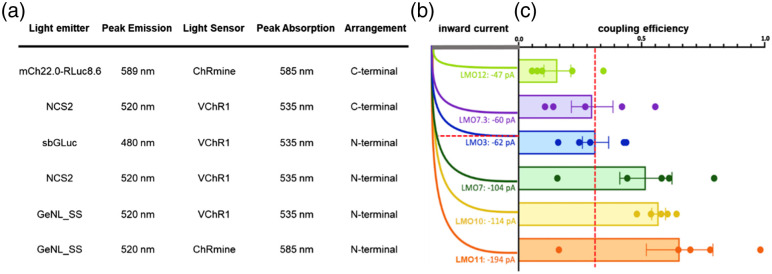
Fig. 10.
Summary of patch clamp recordings in HEK293 cells. (a) Key features of LMOs tabulated in the order displayed in (b) and (c). (b) Representative example of luciferin-induced inward currents for each LMO tested. (c) Coupling efficiency graphs of LMOs tested. Red line in (b) and (c) indicates the level of performance of LMO3, the previously determined standard for a robustly functioning LMO.

