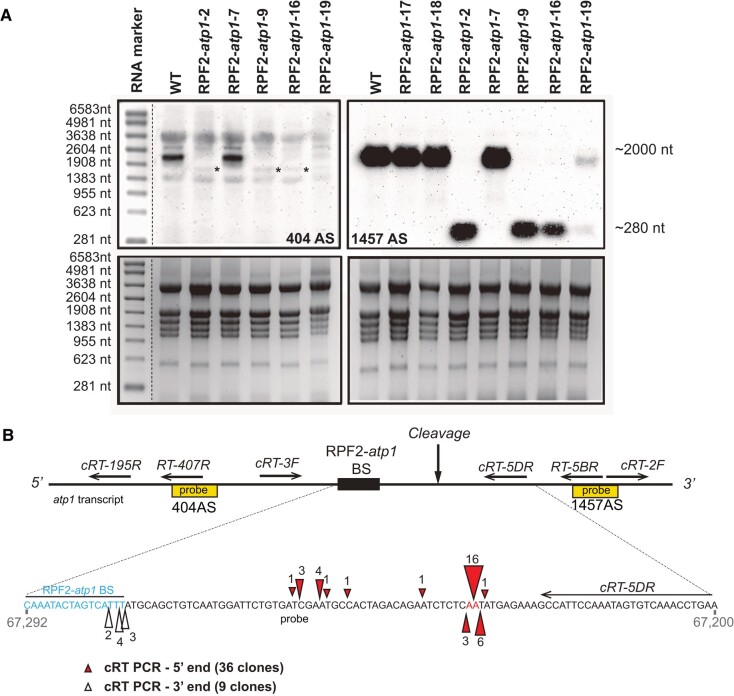
Figure 2.
The atp1 transcript is cleaved in the plants transformed with the RPF2-atp1 constructs. A) Northern blots of leaf RNA isolated from several transformants and WT plants hybridized with atp1 probes 404AS (top left) and 1457AS (top right), respectively, located upstream and downstream of the RPF2-atp1 predicted binding site (BS). The bottom panels show the gels stained with ethidium bromide. The molecular weight marker sizes are indicated on the left-hand side. The asterisks on the 404 AS blot show the faint cleavage bands around 1,760 nt. B) Location of atp1 cleavage in the RPF2-atp1 plants from cRT-PCR results. The top panel indicates the position of the northern probes used in A) (yellow boxes) and cRT PCR primers relative to the predicted binding site (not to scale). The coordinates of the enlarged region on the Col-0 mitochondrial genome BK010421 are 67292 to 67200 (reverse strand). The RPF2-atp1 binding site (67277 to 67292) and the main cleavage sites are highlighted. Red triangles indicate the 5′-ends of the cleaved products and white triangles the 3′-ends of the cleaved products as determined by cRT-PCR. The ends of the 36 clones aligned suggest cleavage between bases 67,224 and 67,225. The figures near the triangles indicate the numbers of clones obtained.

