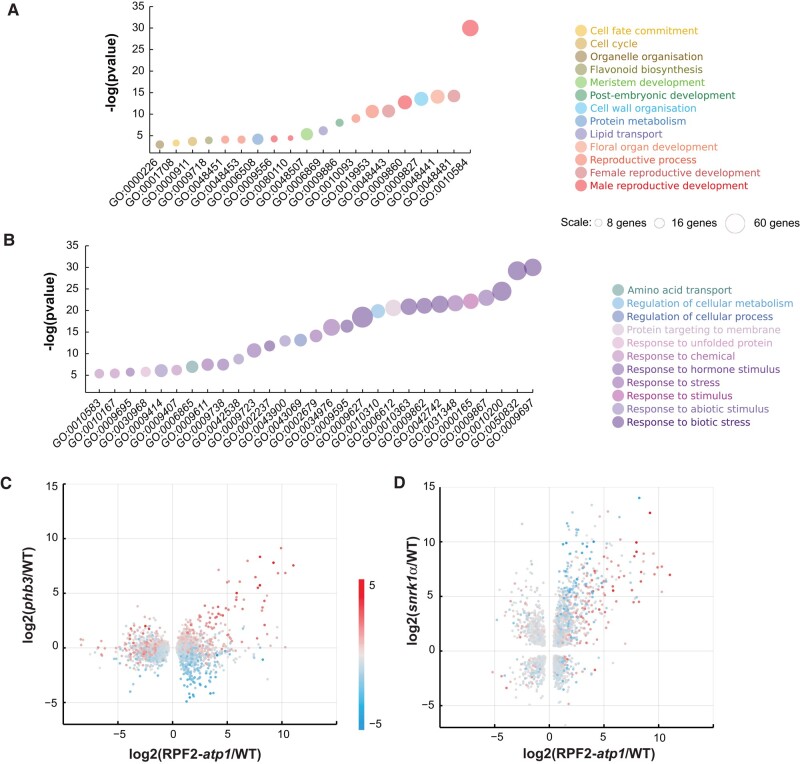
Figure 4.
RNA-seq analysis of WT and RPF2-atp1 plants. A, B) GO Biological Process terms most significantly associated with genes more expressed in WT A) or in RPF2-atp1 plants B). Colors indicate groupings of GO terms into broader categories. The area of the markers is proportional to the number of differentially expressed genes in each category (data are available in Supplementary Tables S3 and S4). The y axis indicates the degree of statistical significance, higher values being more significant (data are available in Supplementary Tables S3 and S4). C) A scatter plot comparing the transcript differences in RPF2-atp1 and phb3 mutants (x axis is log2 fold change between RPF2-atp1 and WT; y axis is log2 fold change between phb3 and WT). Only transcripts that are significantly differentially expressed in RPF2-atp1 mutants are included. The marker color represents the effect of the ANAC017 transcription factor (calculated as the log2 ratio in expression between phb3 mutants and phb3 anac017 double mutants). D) A scatter plot comparing the transcript differences in RPF2-atp1 and snrk1α mutants (x axis is log2 fold change between RPF2-atp1 and WT; y axis is log2 fold change between snrk1α and WT). Only transcripts that are significantly differentially expressed in both mutants are included. The marker color represents the effect of the ANAC017 transcription factor (calculated as the log2 ratio in expression between phb3 mutants and phb3 anac017 double mutants).

