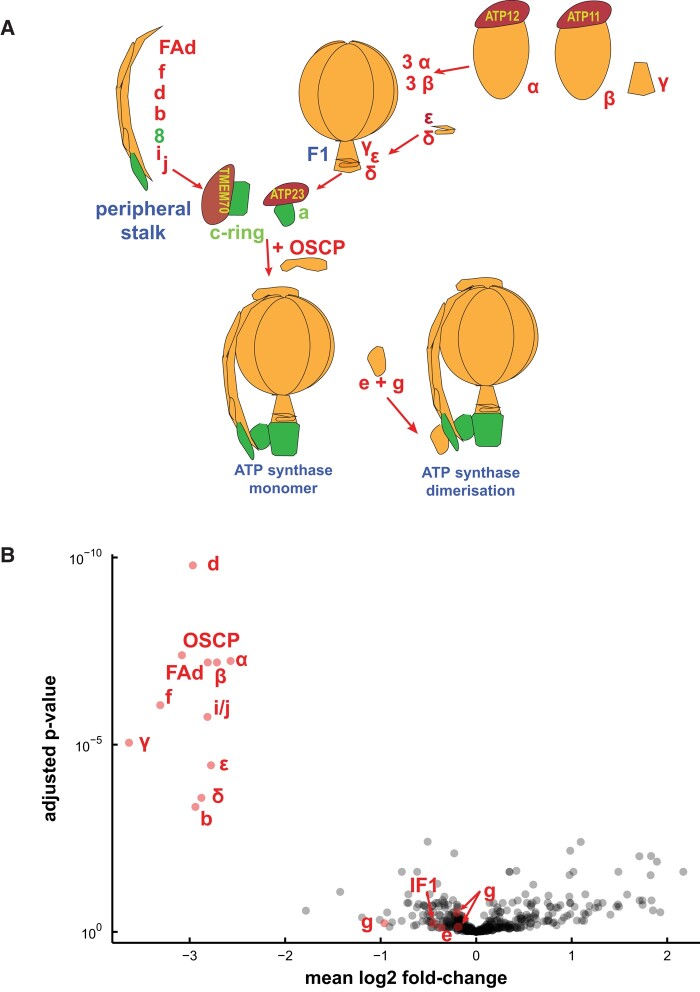
Figure 6.
Most subunits of the ATP synthase complex are less abundant in RPF2-atp1 transformants. A) Simplified representation of the ATP synthase assembly pathway. The subunits found in our proteomics study are labeled in red, and the others are labeled in green. B) A “volcano” plot of relative protein abundances as estimated by quantitative untargeted MS from samples of WT and RPF2-atp1 crude mitochondrial pellets. The x axis indicates the mean log2 fold difference (WT/RPF2-atp1); the y axis indicates the P-value for the hypothesis of equal relative abundance; i.e. points toward the top-left of the plot are significantly less abundant in RPF2-atp1 samples. The plot shows data for 410 proteins of which 17 (in red) are associated with the ATP synthase complex. The plot is based on MS data from 8 RPF2-atp1 samples and 8 phenotypically WT samples (4 from WT plants and 4 from plants expressing the native RPF2).

