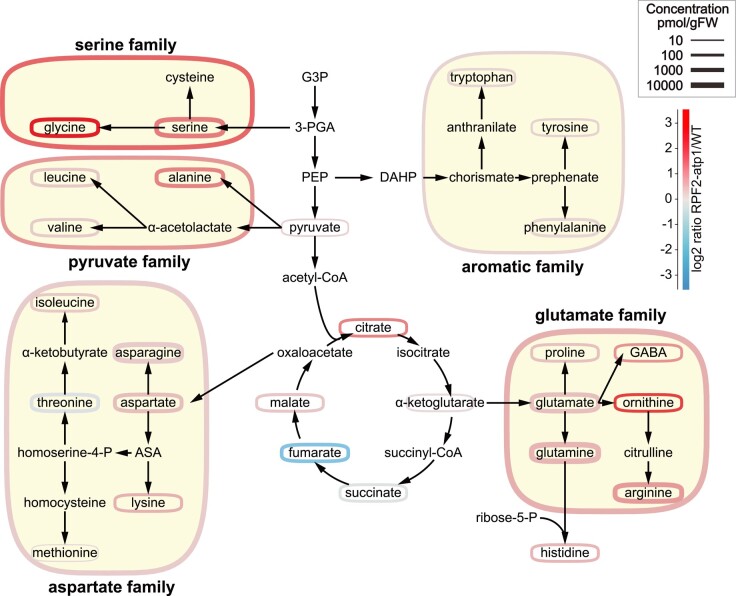
Figure 7.
Perturbed metabolite abundances is in the RPF2-atp1 transformants. Simplified scheme of amino acid synthesis and TCA cycle, adapted from Trovato et al. (2021). The amino acids are grouped by families according to their synthesis pathways. Colors represent the log2 ratio of RPF2-atp1 to WT concentrations (see scale top right). Outline thickness is proportional to the log of the metabolite or metabolite pool concentration. ASA, aspartate semialdehyde; DAHP, 3-deoxy-Dd-arabinoheptulosonate-7-phosphate; G3P, glyceraldehyde 3-phosphate; 3-PGA, 3-phosphoglycerate; PEP, phosphoenolpyruvate.

