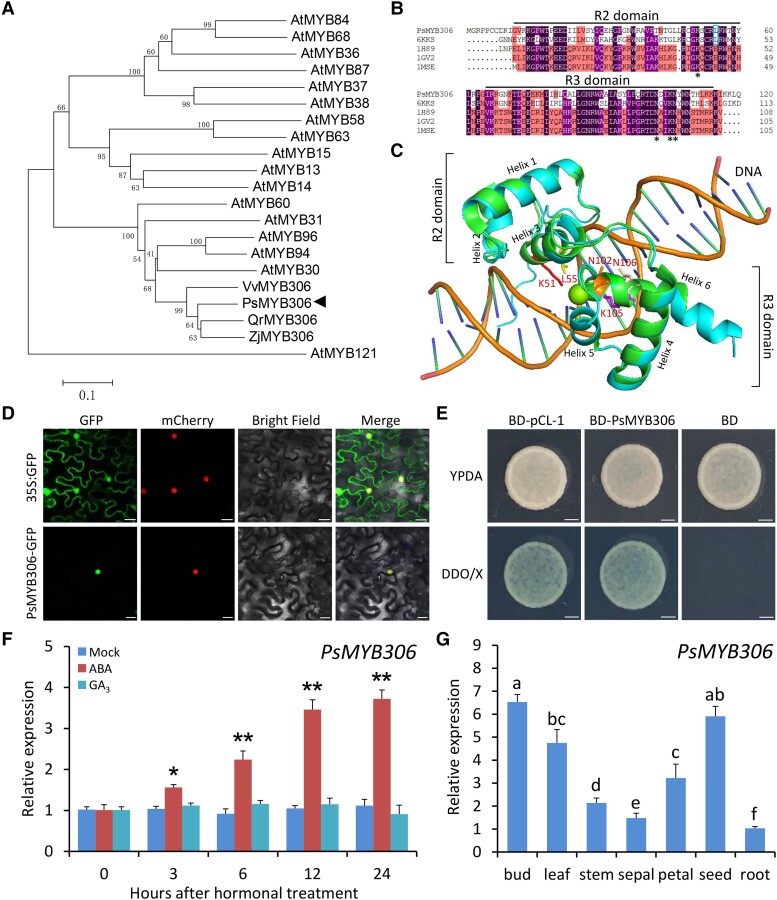
Figure 4.
Sequence structure, transcriptional activity, and expression pattern analyses of PsMYB306. A) Phylogenetic tree of PsMYB306 with V. vinifera VvMYB306, Q. rubra QrMYB306, Z. jujuba ZjMYB306, and other MYB proteins from Arabidopsis. Bootstrap values are expressed as a percentage of 1,000 replicates and shown at branch nodes. PsMYB306 is marked by a solid triangle. AtMYB121, a member of MYB subgroup 17, served as the outgroup. Scale bar represents 0.1 amino acid substitutions per site. B) Amino acid sequence alignment of PsMYB306 with the identified homologous protein templates. Asterisks represent 4 residues related to DNA binding, while the square indicates 1 residue for DNA methylation. C) Protein modeling of PsMYB306 in superimposition with Arabidopsis WER (6KKS). The side chains of the corresponding 5 residues in PsMYB306 are shown as sticks. D) Subcellular localization of PsMYB306 in N. benthamiana leaves based on PsMYB306-GFP fusion. H2B-mCherry was used to mark the nuclei. Scale bars = 20 μm. E) Transcriptional activation of PsMYB306 in S. cerevisiae cells. The pCL-1 and the empty vector (BD) were used as positive and negative controls, respectively. Scale bars = 15 mm. RT-qPCR analysis of expression levels of PsMYB306 in the buds treated with 100 μM ABA and 100 μM GA (GA3) at intervals F) and in different organs or tissues of tree peony G). PsActin was used as an internal control. Error bars represent Se of the mean from 3 biological replicates. Asterisks or letters indicate statistical significance as calculated by Student's t test (*P < 0.05, **P < 0.01).

