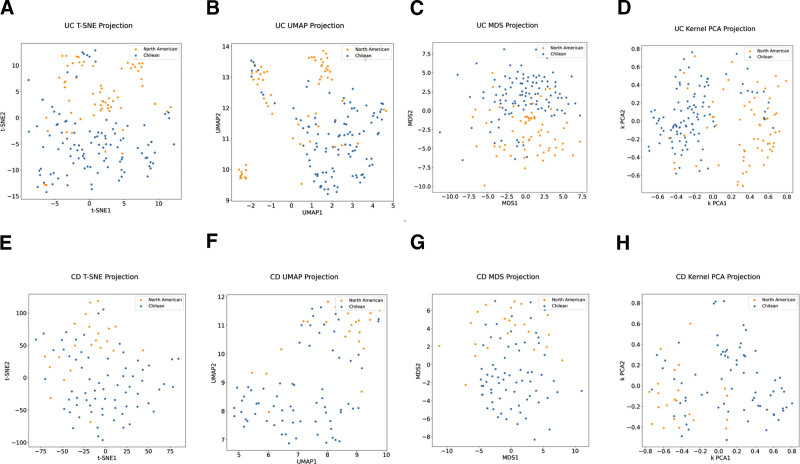
Figure 3.
Dimensional reduction of IBD patient clinical data. (A–D) Ulcerative colitis patients’ data represented using t-SNE, UMAP, MDS, Kernel PCA (left to right). (E–H) Crohn Disease patients represented by the same algorithms. Patient Cohort or “center” is represented in blue for Chile and yellow for UCSD. nUC = 173, nCD = 92. IBD = inflammatory bowel disease, MDS = multidimensional scaling, PCA = principal component analysis, t-SNE = t-distributed stochastic neighbor embedding, UMAP = uniform manifold approximation, and projection, UCSD = University California San Diego.

