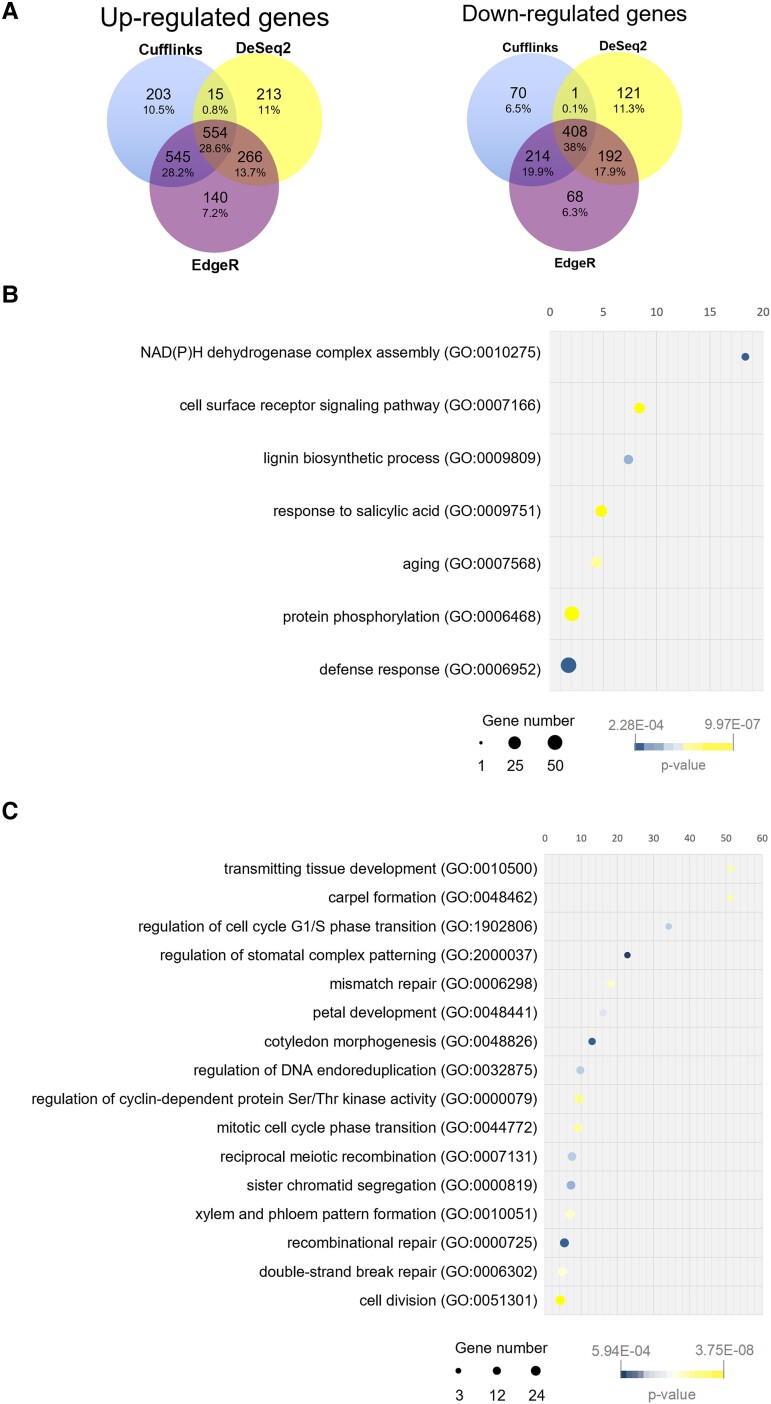
Figure 2.
Reproductive tract transcriptomic comparison of wild-type and hda19-3 flowers. A) Venn diagrams showing the overlap of up- and downregulated genes (FDR < 0.001 and logFC > |1.5|) detected by Cufflinks, EdgeR, and DeSeq2. B) Enrichment analysis of “Biological Process” GO terms associated with upregulated genes (logFC > |1.5|) detected by all three programs. C) Enrichment analysis of “Biological Process” GO terms associated with downregulated genes (logFC > |1.5|) detected by all three programs (fold enrichment > 4). Graphs show overrepresented child-most (tip) GO terms. Parent GO terms (root terms) have not been plotted for simplicity. Enrichment analysis was performed using Panther (Mi et al. 2018, 2019) with the default parameters set by the program.

