Fig. 2.

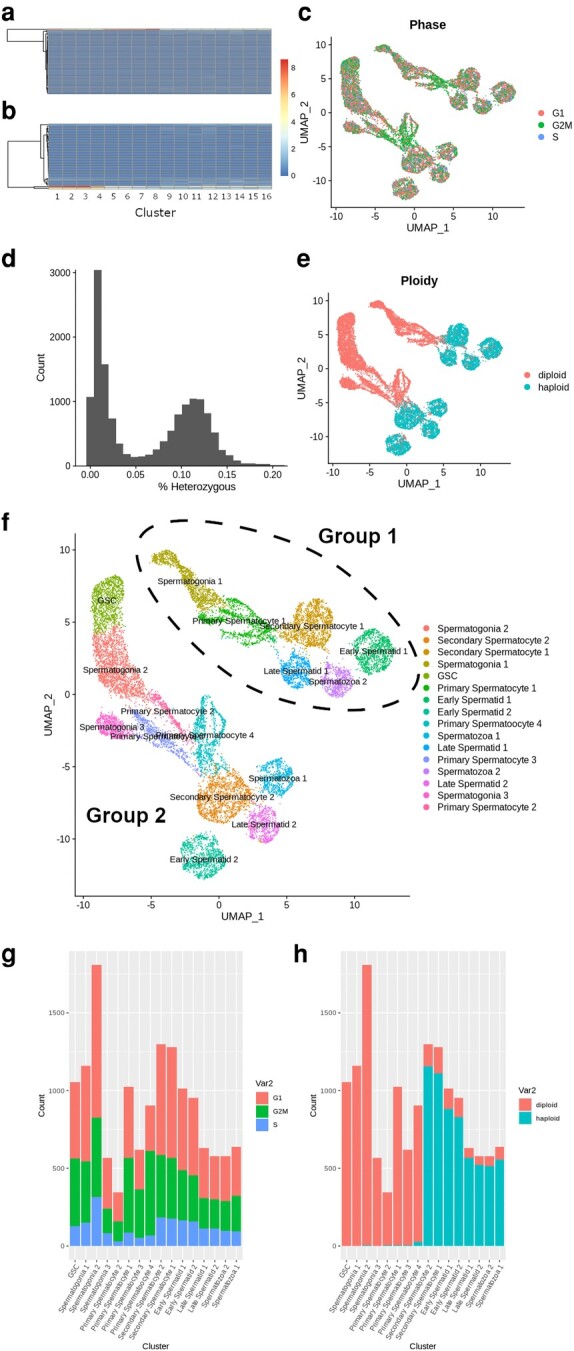
Identification of cluster cell types using phasing evidence. a and b) Expression of a) G2M and b) S phase specific expression markers as rows across cell clusters in columns. c) Estimated mitotic phase of each cell displayed in UMAP projection from homologous Drosophila markers. d) Histogram showing the distribution of cells as a function of their percent heterozygosity. Heterozygosity estimated from SNPs in sequenced reads may not represent actual allele status due to low sequencing coverage and variable gene expression. e) Ploidy status of each cell as inferred from cells < 5% heterozygous across alleles. f) Inferred cell type using multiple evidences. Parallel clusters independently separated during UMAP construction represent 2 distinct groups labeled group 1 and group 2. g and h) Stacked barplots showing the total numbers of g) G1, G2M, and S and h) haploid and diploid phased cells in each cluster.
