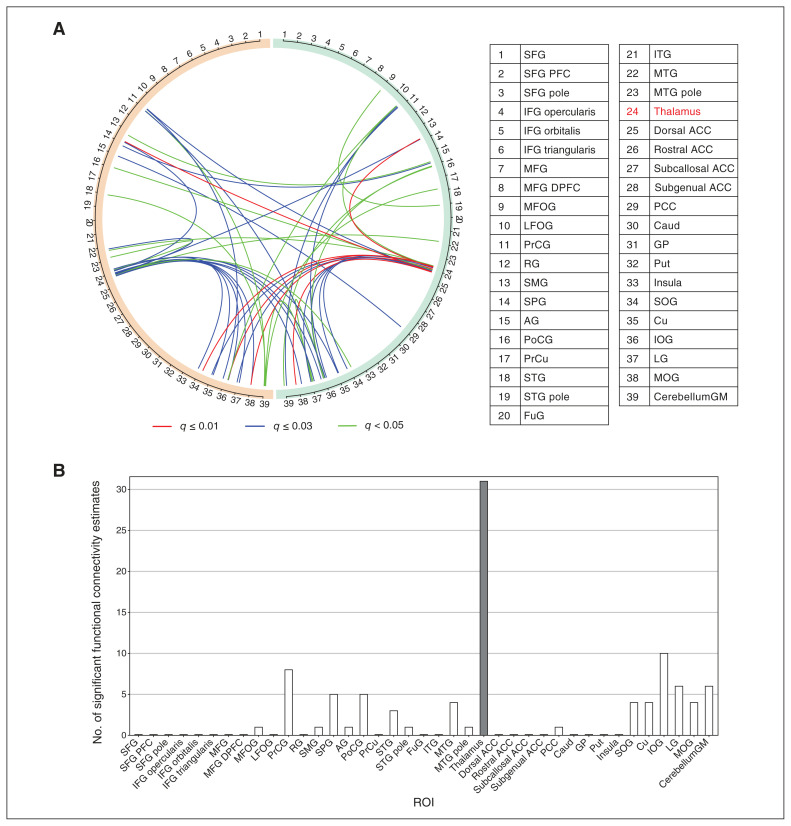
Figure 1.
Altered functional connectivity in the relapse group, compared with the control group. (A) Visualization of 47 significant functional connectivity estimates. Orange and green semicircles represent the left and right brain hemispheres, respectively. Numbers on the semicircles denote regions of interest (ROIs). The thalamus, number 24, is highlighted in red. Lines between numbers represent functional connectivity. Estimates with q-values smaller than 0.01, 0.01–0.03, or 0.03–0.05 are in red, blue, or green, respectively. (B) Number of significant functional connectivity estimates of each ROI. Most estimates (30 of 47) involved the thalamus (highlighted with a dark bar). Note: ACC = anterior cingulate cortex; AG = angular gyrus; Caud = caudate nucleus; CerebellumGM = cerebellum grey matter; Cu = cuneus; FuG = fusiform gyrus; GP = globus pallidus; IFG = inferior frontal gyrus; IOG = inferior occipital gyrus; ITG = inferior temporal gyrus; LFOG = lateral fronto-orbital gyrus; LG = lingual gyrus; MFG = middle frontal gyrus; DPFC = dorsolateral prefrontal cortex; MFOG = middle fronto-orbital gyrus; MOG = middle occipital gyrus; MTG = middle temporal gyrus; PCC = posterior cingulate cortex; PFC = prefrontal cortex; PoCG = postcentral gyrus; PrCG = precentral gyrus; PrCu = precuneus; Put = putamen; RG = gyrus rectus; SMG = supramarginal gyrus; SOG = superior occipital gyrus; SPG = superior frontal gyrus; STG = superior temporal gyrus.

