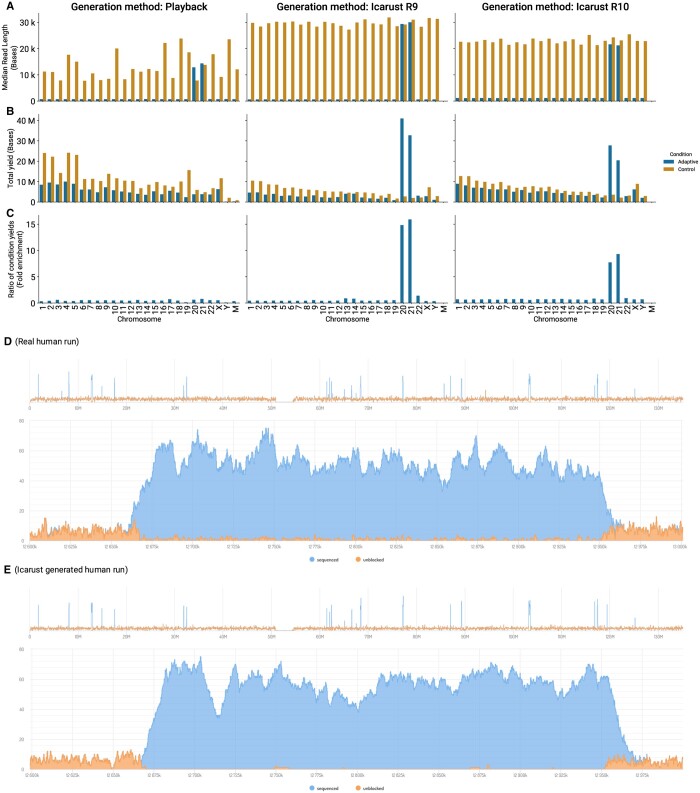
Figure 1.
Comparison of an adaptive sampling experiment, targeting Chromosomes 20 and 21 on the human genome, between two simulated runs. The left column visualizes data generated using MinKNOWs playback, the middle column data generated using Icarust with R9 data, the right column data generated using Icarust with R10 data. The two run conditions, Control (orange) or Adaptive sampling (blue) are shown. (A). The median read length of the two runs for each condition. (B). The total yield in bases of the two runs for each condition. (C). The difference between the yield in the Adaptive and Control conditions as the fold change for each run. (D, E) Coverage plots showing the same adaptive sampling target (Chr 11, 12,666,921–12,952,237) from a real human sequencing run, and a replication run, simulated using Icarust R9 data. The top section of the plots shows the whole coverage over Chr 11. Coverage is split between Sequenced (Blue) and Unblocked reads (Orange). Charts plotted by MinoTour.

