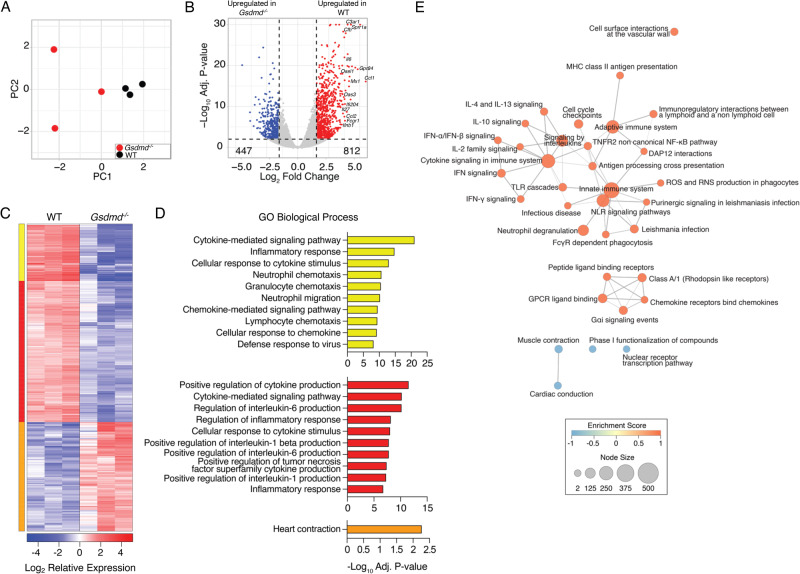
Fig. 3. GSDMD promotes inflammatory gene expression programs in IAV infection.
A–E WT and Gsdmd−/− mice were infected with IAV strain PR8 at a dose of 50 TCID50. RNA was extracted from n = 3 WT and Gsdmd−/− mouse lungs at day 7 post infection and subjected to RNA sequencing. A Principal component analysis comparing WT and Gsdmd−/− lung RNA sequencing results. Each dot represents an individual mouse. B Volcano plot of differential gene expression (lfc |1.5 | , adj p-value < 0.01 determined using DEseq2) comparing WT vs Gsdmd−/− mice. Red, 812 genes upregulated in WT vs KO; Blue, 447 genes downregulated in WT vs Gsdmd−/−. C Hierarchical clustering of differentially expressed genes. Heatmap represents relative gene expression where red indicates genes with upregulated expression and blue indicates genes with downregulated expression, with each column representing an individual mouse. Cluster color indicates genes with similar patterns of expression in infected WT mice compared to infected Gsdmd−/− mice. D Gene ontology analysis for genes within each cluster. Bar graphs represent the top 10 enriched GO terms enriched within each cluster from C as indicated by color. Bar length represent the -log10 adjusted p-value for significantly enriched pathways (-Log10 adj p-value > 1.3 by topGO enrichment analysis for gene ontology). E Network of GO Biological Process terms enriched by gene set enrichment analysis. Node size represents number of genes within each pathway. Edges represent the number of shared genes across GO Biological Process terms. Color indicates the Enrichment Score where orange indicates a positive score and blue indicates a negative score for transcriptional signatures derived from WT infected lungs relative to Gsdmd−/− lungs.

