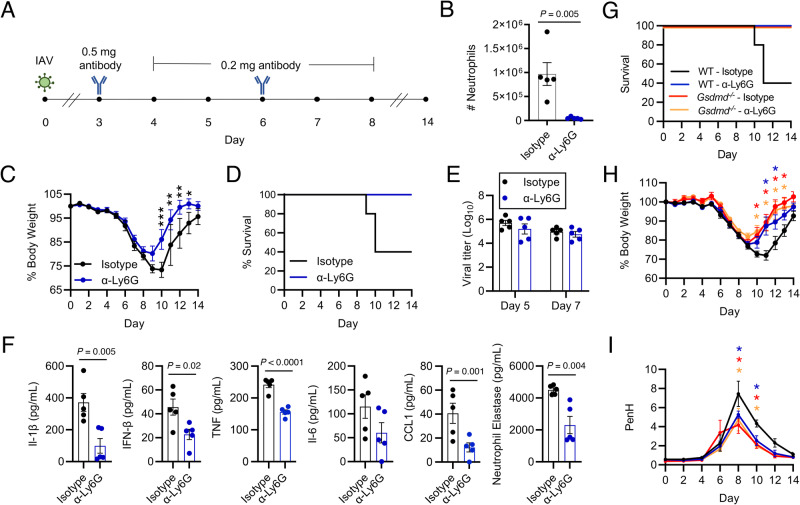
Fig. 6. Neutrophils increase influenza severity.
A Schematic of IAV infection (50 TCID50) and antibody injections for (B–I). B Neutrophil number in the lungs of n = 5 WT and Gsdmd−/− mice on day 5 by flow cytometry (each dot represents an individual mouse, error bars indicate SEM, p value by two-tailed unpaired t-test). C Weight loss of n = 7 mice per group (each dot is an average of individual mouse weights normalized to 100% relative to day 0, error bars indicate SEM, *p < 0.05, *p < 0.01, ***p < 0.0001 by two-way ANOVA followed by Bonferroni multiple comparisons test). D Survival analysis. E Viral titers from lung homogenates with n = 5 per group (Each dot represents an individual mouse, error bars indicate SEM, no statistically significant differences were detected comparing WT and Gsdmd−/− samples by two-way ANOVA followed by Tukey’s multiple comparisons test). F ELISA measurements on lung homogenates from day 7 post infection of n = 5 per group (each dot represents an individual mouse, p values determined by two-tailed unpaired t-test). G Survival analysis of infected WT and Gsdmd−/− mice treated as in (A) with n = 6 per group. H Weight loss of n = 6 mice (each dot is an average of individual mouse weights normalized to 100% relative to day 0, error bars indicate SEM, *p < 0.05 by two-way ANOVA followed by Bonferroni multiple comparisons test, asterisks indicate respective color-coded comparisons to WT—Isotype). Colored lines correspond to groups as in (G). I PenH measurements by whole body plethysmography (each dot is an average of n = 6 mice, error bars indicate SEM, *p < 0.05 by two-way ANOVA followed by Bonferroni multiple comparisons test, asterisks indicate respective color-coded comparisons to WT—Isotype). Colored lines correspond to groups as in (G). Data in (B–F) represent one experiment and data in (G–I) represent one additional independent experiment. Source data are provided in the Source Data file.

