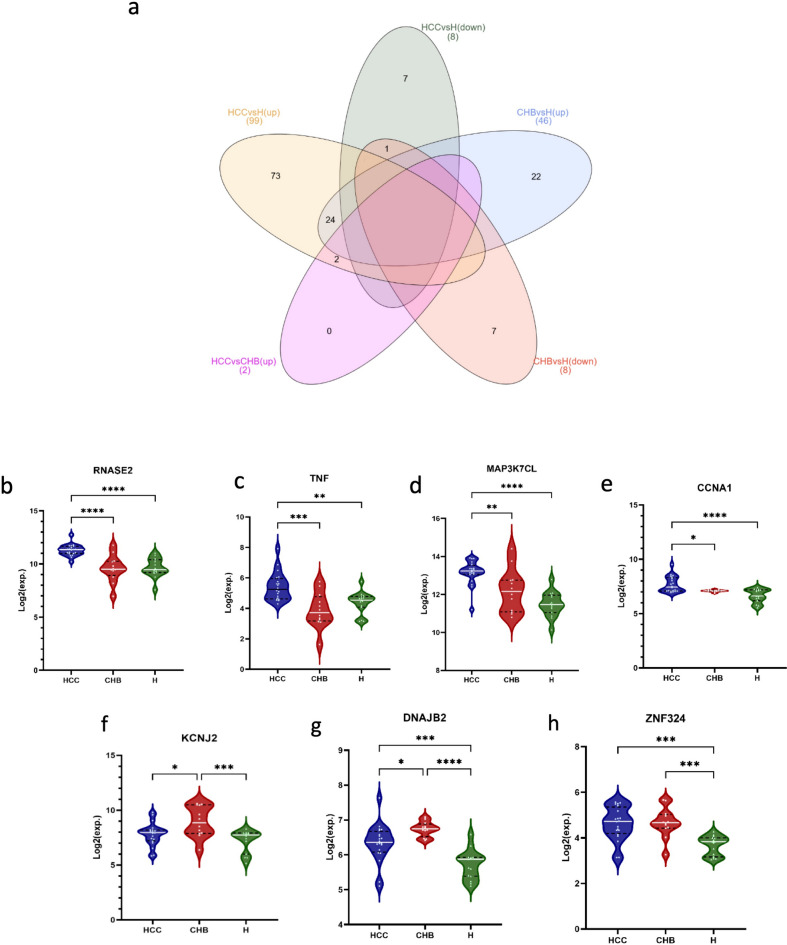
Figure 5.
Identification of specific genes for HCC and CHB cases. (a) Venn diagram represents the intersection between upregulated and downregulated genes in HCC and CHB compared to healthy controls. It demonstrated that there are 73, and 22 unique upregulated genes for HCC and CHB compared to healthy controls, respectively. The violin plots represent the expression levels of (b) RNASE2, (c) TNF, (d) MAP3K7, (e) CCNA1, (f) KCNJ2, (g) DNAJB2, and (h) ZNF324. X-axis represents HCC (left), CHB (middle) and healthy control (right), Y-axis represents mRNA expression in log2.

