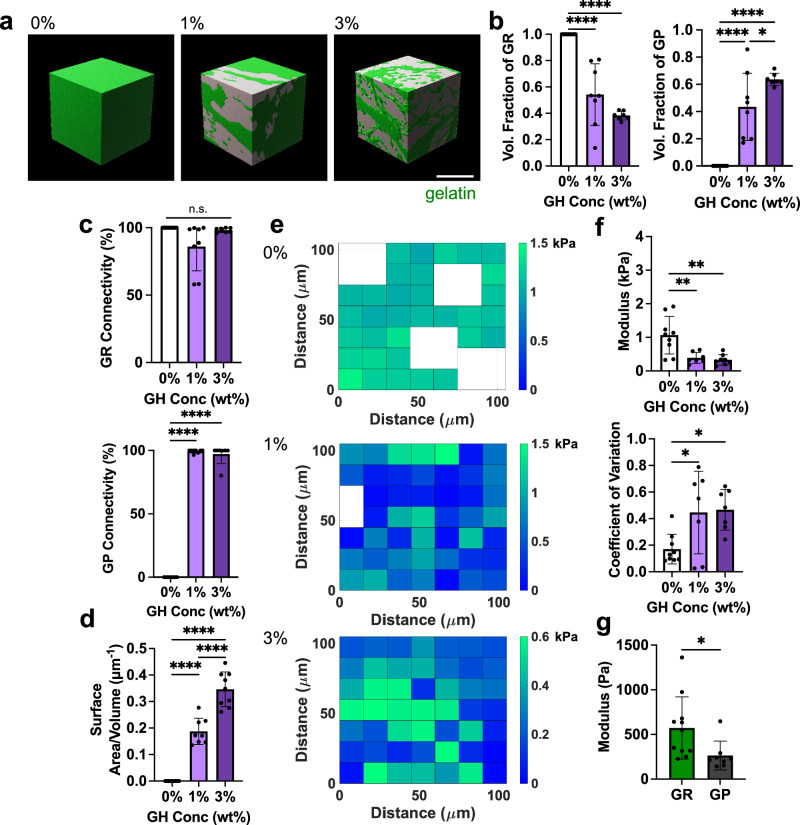
Fig. 2. Bicontinuous hydrogel structural and mechanical characterization.
a Representative 3D reconstructions of hydrogels containing various GH content (0, 1, 3 wt%), revealing bicontinuous structures in 1 and 3 wt% hydrogels (gelatin-rich (GR, green) and gelatin-poor (GP, gray) domains). Scale bar = 50 μm. b Fraction of total volume occupied by GR (left panel) and GP (right panel) domains within hydrogels. n = 9 (0%), 8 (1%), or 7 (3%) regions across 3 hydrogels per condition. Left panel: 0% vs. 1%, 1% vs. 3% ****p ≤ 0.0001. Right panel: 0% vs. 1%, 0% vs. 3% ****p ≤ 0.0001; 1% vs. 3% *p = 0.0353; one-way ANOVA with Tukey post hoc. c Quantification of connectivity (defined by percent of total volume occupied by largest individual domain) of GR (top) and GP (bottom) domains. n = 9 (0%), 8 (1%), or 7 (3%) regions across 3 hydrogels per condition. Upper panel: n.s. indicates no statistical significance. Lower panel: 0% vs. 1%, 0% vs. 3% ****p ≤ 0.0001; one-way ANOVA with Tukey post hoc. d Quantification of interfacial surface area normalized to sample volume across hydrogels containing various GH content (0, 1, 3 wt%). n = 9 (0, 3%) or 8 (1%) regions across 3 hydrogels per condition. 0 % vs. 1%, 0% vs. 3%, 1% vs. 3% ****p ≤ 0.0001; one-way ANOVA with Tukey post hoc. e Representative elastic modulus maps determined with AFM-nanoindentation (empty nodes denote removed outliers). f Average elastic moduli (top) and coefficient of variation (CV, bottom) across AFM profiles. n = 9 (0%), 7 (1%), 8 (3%) grids across 3-4 hydrogels per condition. Upper panel: 0% vs. 1% **p = 0.0041; 0% vs. 3% **p = 0.0014. Lower panel: 0% vs. 1% *p = 0.0354; 0% vs. 3% *p = 0.0228; one-way ANOVA with Tukey post hoc. g Quantification of averaged elastic moduli of GR and GP domains across probed grids for 1 wt% GH hydrogel using AFM based on differential fluorescent labeling (individual data points in Supplementary Fig. 7d). n = 8 (GP) or 11 (GR) grids across 5 hydrogels. *p = 0.0333; Two-tailed unpaired students t-test. Data are mean ± s.d. Source data for (b–g) provided as a source data file.

