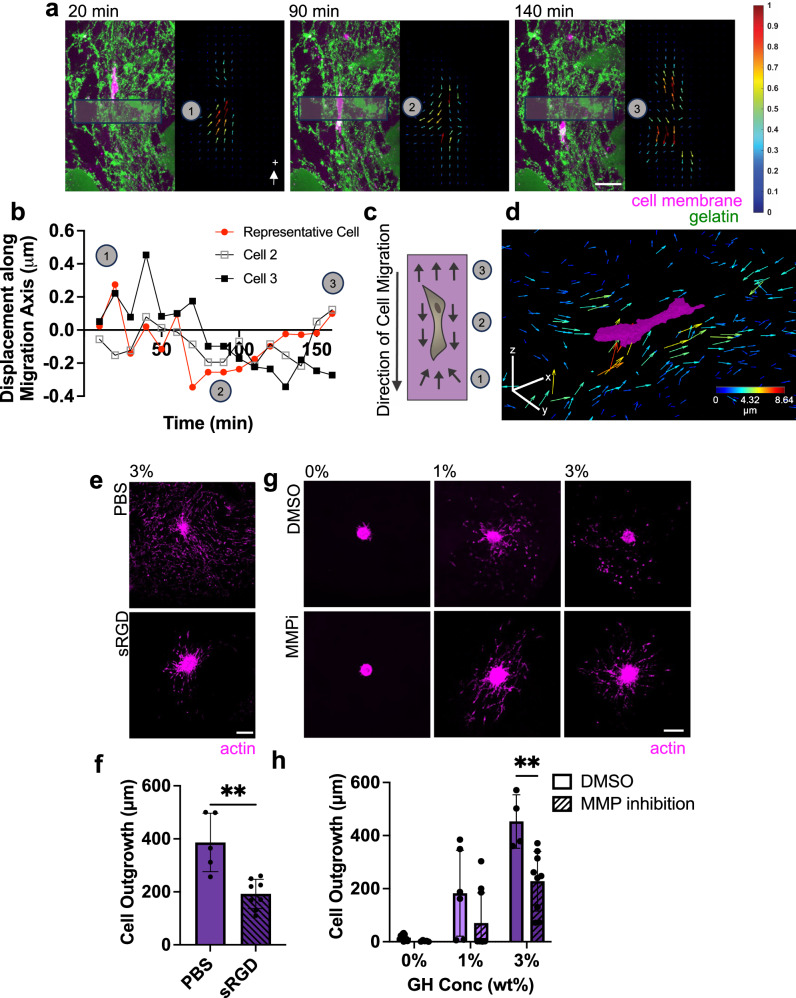
Fig. 4. Migratory cells utilize adhesion-based mesenchymal migration strategies.
a, b Representative 5 μm maximum Z projection of a cell migrating through a 3 wt% GH hydrogel (left, GR domain: green, actin: magenta) and corresponding particle image velocimetry (right, colored arrows with magnitude normalized per frame) over time (a, Scale bar = 50 μm, labeled time denotes time elapsed from the beginning of imaging on day 3) and corresponding quantification of the average bead displacement vector contribution along the axis of migration within boxes in panel a over time (b, representative of 3 migrating cells across 2 biologically independent experiments, with cell corresponding to panel a denoted in red). c Schematic of cell migrating in 3 wt% GH hydrogel (numbered markers denote approximate phase of migration that correspond to panels a, b). d Representative cell (magenta) and corresponding 3D representation of top 25% of bead displacements, in which each arrow represents a discrete bead and color corresponds with magnitude (with arrows magnified 6x for visualization). Color bar = 40 μm. e, f Representative actin (magenta) images of MFCs at day 3 treated with soluble RGD (sRGD) compared to PBS control (e, Scale bar = 200 μm), and corresponding quantification (f). n = 5 (PBS) or 8 (sRGD) spheroids per condition from 2 biologically independent experiments. **p = 0.0013; Two-tailed unpaired student’s t-test. g, h Representative actin (magenta) images of MFCs at day 3 treated with 100 μM MMP inhibitor (MMPi) or DMSO control (g, Scale bar = 200 μm), and corresponding quantification (h). n = 4 (3%-DMSO), 6 (1%-DMSO), 9 (3%-MMPi), 10 (0,1%-MMPi), or 12 (0%-DMSO) spheroids from 2 biologically independent experiments. **p = 0.0024; two-way ANOVA with Tukey post hoc. Data are mean ± s.d. Source data for (b, f, h) provided as a source data file.

