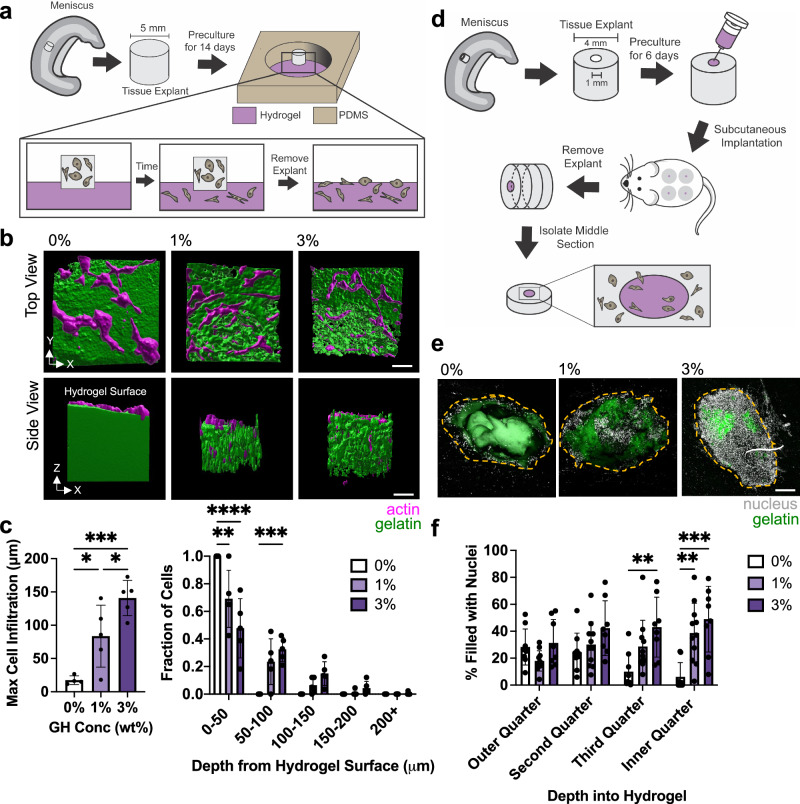
Fig. 6. Microinterfaces support increased cell infiltration ex vivo and in vivo.
a Overview of ex vivo study design where meniscus explants are placed on top of each condition and cells are allowed to infiltrate the hydrogel. Modified with permission from3. b 3D reconstructions of actin (magenta)-GR domain (green) interactions after 6 days. Scale bar = 50 μm c Quantification of maximum infiltration (left, through determining 95% quantile) and extent of cell infiltration through hydrogel depth (right). n = 4 (0%) or 5 (1,3%) explants per condition from two biologically independent experiments. Left panel: 0% vs. 1% *p = 0.0282; 1% vs. 3% *p = 0.0424; 0% vs. 3% ***p = 0.0004; One-way ANOVA with Tukey post hoc. Right panel: 0–50: 0% vs. 1% **p = 0.0021; 0–50: 0% vs. 3% ****p ≤ 0.0001; 50–100: 0% vs 3% ***p = 0.0009; Two-way ANOVA with Tukey post hoc. d Overview of in vivo study design where hydrogels are injected into meniscus explant defects and implanted subcutaneously into rats, with the middle region of the explant removed for analysis. e Representative images of nuclei (white) within hydrogels (green) after 14 days (orange dashed line denotes approximate defect edge). Scale bar = 200 μm. f Quantification of cell density within binned quartiles of defect space. n = 8 (0,3%) or 11 (1%) explants per condition across 8 rats. Third Quarter: 0% vs. 3% **p = 0.0086; Inner Quarter: 0% vs. 1% **p = 0.0038; Inner Quarter: 0% vs. 3%: ***p = 0.0001; two-way ANOVA with Tukey post hoc. Data are mean ± s.d. Source data for (c, f) provided as a source data file.

