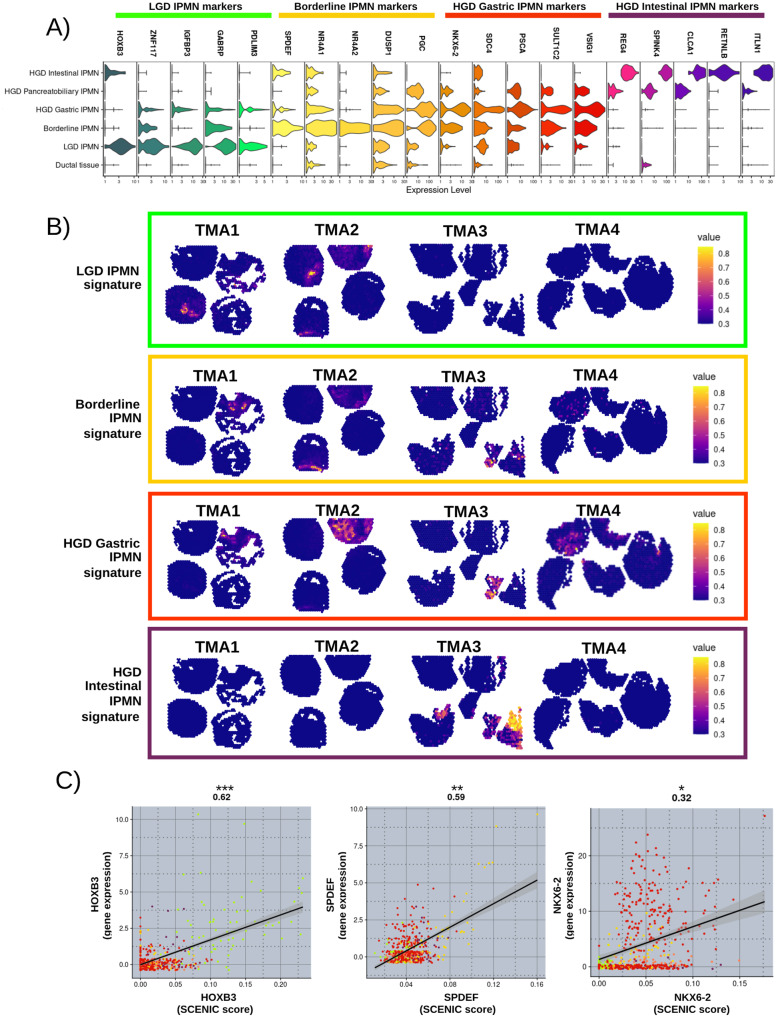
Fig. 3. IPMN cluster marker signatures.
A Normalized expression of the top markers of each IPMN cluster identified by DE analysis. B Visualization of the IPMN clusters gene markers as signatures - LGD IPMN signature: HOXB3, ZNF117, IGFBP3, GABRP, PDLIM3; Borderline IPMN signature: SPDEF, NRA4A1, NR4A2, DUSP1, PGC; HGD Gastric IPMN signature: NKX6-2, PSCA, SULT1C2, VSIG1; HGD Intestinal IPMN: REG4, SPINK4, CLCA1, RETNLB, ITLN1. Color scales indicate the score for the gene set activity of each signature. C Correlation between transcription factor activity (SCENIC Score) and gene expression of HOXB3, SPDEF, and NKX6-2. Two-sided Pearson correlation value was showed on the top of each correlation plot with associated p-value (***<0.001; **<0.01; *<0.05). Smoothness: HOXB3 (95% CI = 0 0.56–0.67, df = 515, SE = 0.03); SPDEF (95% CI = 0.52–0.63, df = 515, SE = 0.03); NKX6-2 (95% CI = 0.23–0.39, df = 515, SE = 0.04). Each dot color refers to the annotation to the different IPMN clusters assigned (light green= LGD IPMN; yellow= Borderline IPMN; red= HGD Gastric IPMN; orange= HGD Pancreatobiliary IPMN; violet= HGD Intestinal IPMN). Source data are provided as a Source Data file. TMA tissue micro array, LGD low-grade-dysplasia, HGD high-grade-dysplasia, PDAC pancreatic ductal adenocarcinoma, CI confidence interval, df degrees of freedom, SE standard error.

