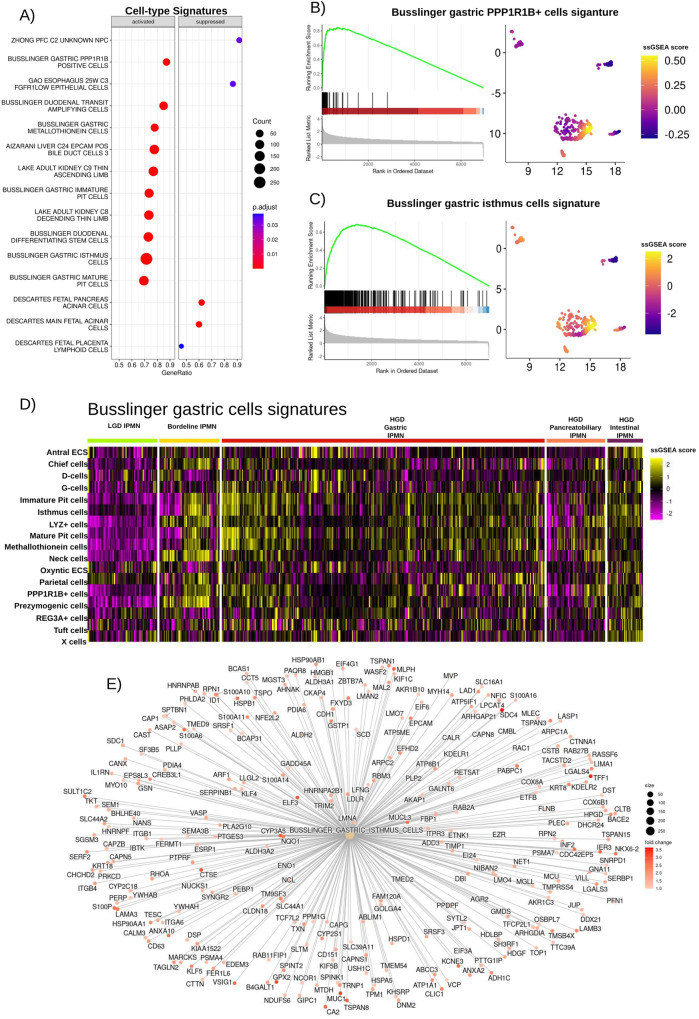
Fig. 5. GSEA results showing cell type specific signatures associated with HGD gastric IPMN.
A Dotplot showing the top cell type specific signatures upregulated and suppressed in HGD Gastric IPMN when compared to LGD IPMN. Two-tailed GSEA corrected for multiple comparisons with FDR < 0.05. B GSEA plot for the BUSSLINGER_GASTRIC_PP1R1B_POSITIVE_CELLS signature. C GSEA plot for the BUSSLINGER_GASTRIC_ISTHMUS_CELLS signature. D A heatmap displaying ssGSEA scores for each of the gastric cell signatures identified by Busslinger and colleagues, calculated for all the spots associated with IPMN clusters. Source data are provided as a Source Data file. E Networkplot showing the overexpression of gene included in the Busslinger Gastric Isthmus cell signature in HGD Gastric IPMN in respect to LGD IPMN. TMA tissue micro array, LGD low-grade-dysplasia, HGD high-grade-dysplasia, FDR false discovery rate.

