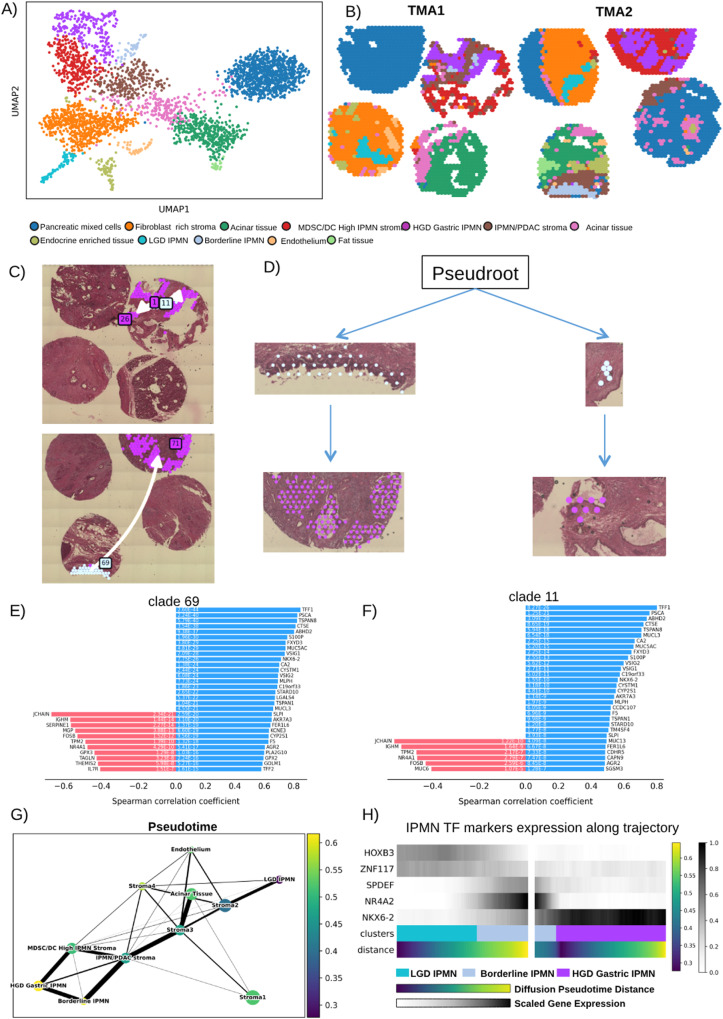
Fig. 7. stLearn clustering and spatial trajectory of gastric IPMN.
A UMAP plot showing clustering identified by stLearn on TMA1 and TMA2. B Spatial visualization of stLearn clusters. C, D show the trajectories identified leading from Borderline IPMN local sub-clusters clade 69 and clade 11 (Angel blue) to HGD Gastric IPMN (Purple). Spearman Coefficient Correlation of transition markers identified to be associated with trajectory toward HGD Gastric IPMN of clade 69 (E) and clade 11 (F). G Diffusion showing the association between Pseudotime showing the evolution from LGD to HGD Gastric IPMN. H Heatmap showing the correlation with the expression of the transcription factors that we have identified to be markers of LGD IPMN (HOXB3, ZNF117), Borderline IPMN (SPDEF, NR4A2), HGD Gastric IPMN (NKX6-2). MDSC myeloid derived suppressor cell, DC dendritic cell, TMA tissue micro array, LGD low-grade-dysplasia, HGD high-grade-dysplasia.

