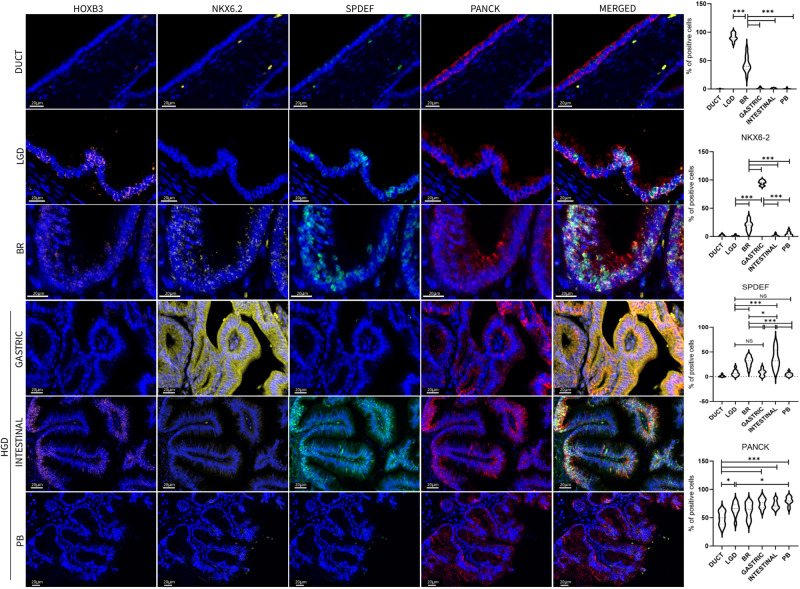
Fig. 8. Multiplex Immunofluorescence validation of the main markers identified by ST analysis.
Images shown are representative of 1 out of more than 10 fields acquired for each case and reviewed by pathologist. Scale bars of 20 μm are indicated in micrograph. Bar-plots show percentage of IPMN epithelial positive cells. Tukey’s multi comparisons test was used to compare the differences among IPMN types (Bonferroni adjusted p-value ***<0.001, **<0.01, NS = not significant, df = 54). Source data are provided as a Source Data file. TMA tissue micro array, LGD low-grade-dysplasia, BR borderline, HGD high-grade-dysplasia, PB Pancreatobiliary.

