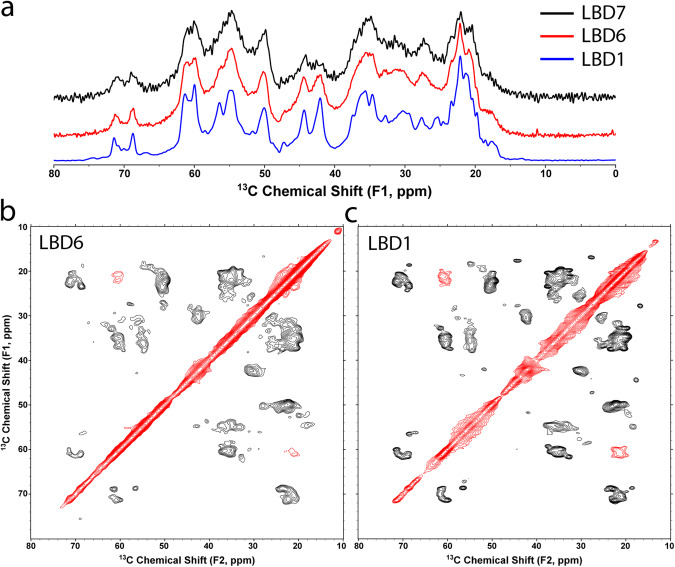
Fig. 7. Spectral comparison of amplified fibrils from three LBD cases.
a 1D 13C cross polarization spectra show the rigid fibril cores of LBD1 (blue), LBD6 (red) and LBD7 (black) amplified fibrils. The aliphatic region of the spectra is shown, highlighting the similarities in the peak positions and relative intensities between the samples. b, c 2D 13C-13C correlation spectra with 1 ms POSTC7 mixing of (b) LBD6 and (c) LBD1 fibrils. Black contours (positive) correspond to correlations between bound 13C nuclei pairs, and red contours (negative) correspond to correlations of 13C nuclei two atoms apart. The chemical shifts are highly similar overall, in particular for diagnostic sidechains of Ala, Thr and Val residues.

