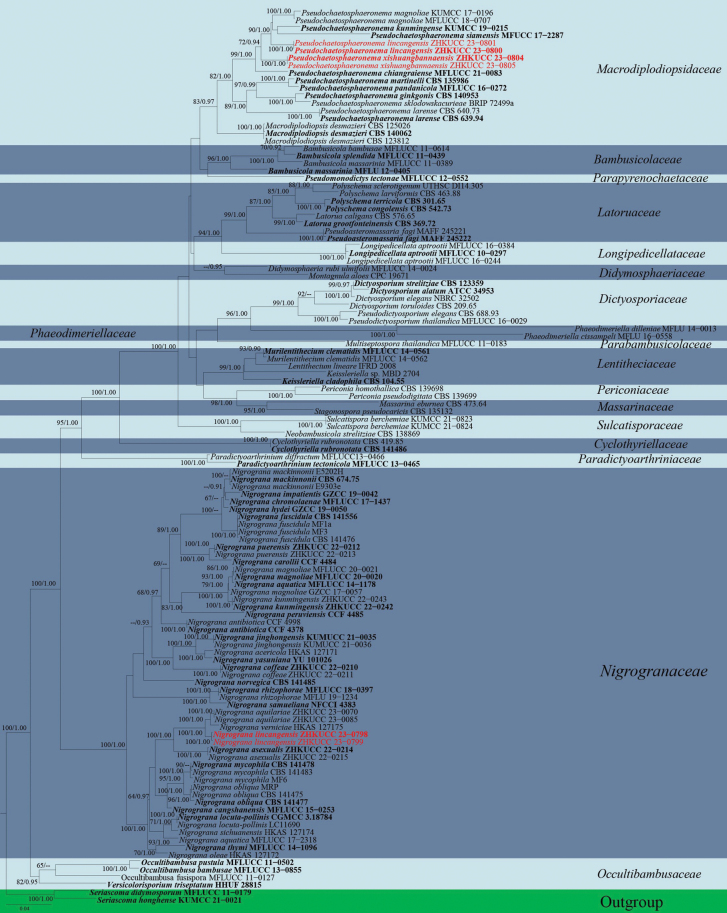
Figure 3.
Phylogram generated from Maximum Likelihood analysis based on combined LSU, ITS, SSU, tef1-α and rpb2 sequence data of 119 taxa, which comprised 4399 base pairs (LSU = 908 bp, ITS = 512 bp, SSU = 1000 bp, tef1-α = 925 bp, rpb2 = 1054 bp). The best scoring RAxML tree with a final likelihood value of -38918.764563 is presented. The matrix had 2023 distinct alignment patterns, with 39.00% of undetermined characters or gaps. Estimated base frequencies were as follows: A = 0.245191, C = 0.247520, G = 0.268228, T = 0.239061; substitution rates: AC = 1.533778, AG = 3.877174, AT = 1.672983, CG = 1.254032, CT = 8.838860, GT = 1.000000; gamma distribution shape parameter α = 0.208600. Bootstrap support values for ML equal to or greater than 60% and Bayesian Inference analysis values equal to or greater than 0.90 PP are labelled at each node. The tree is rooted with Seriascomadidymospora (MFLUCC 11–0179) and S.didymospora (MFLUCC 11–0194). Related sequences were obtained from De Silva et al. (2022), Lu et al. (2022) and Li et al. (2023). The new isolates are indicated in red and the ex-type strains are in bold.

