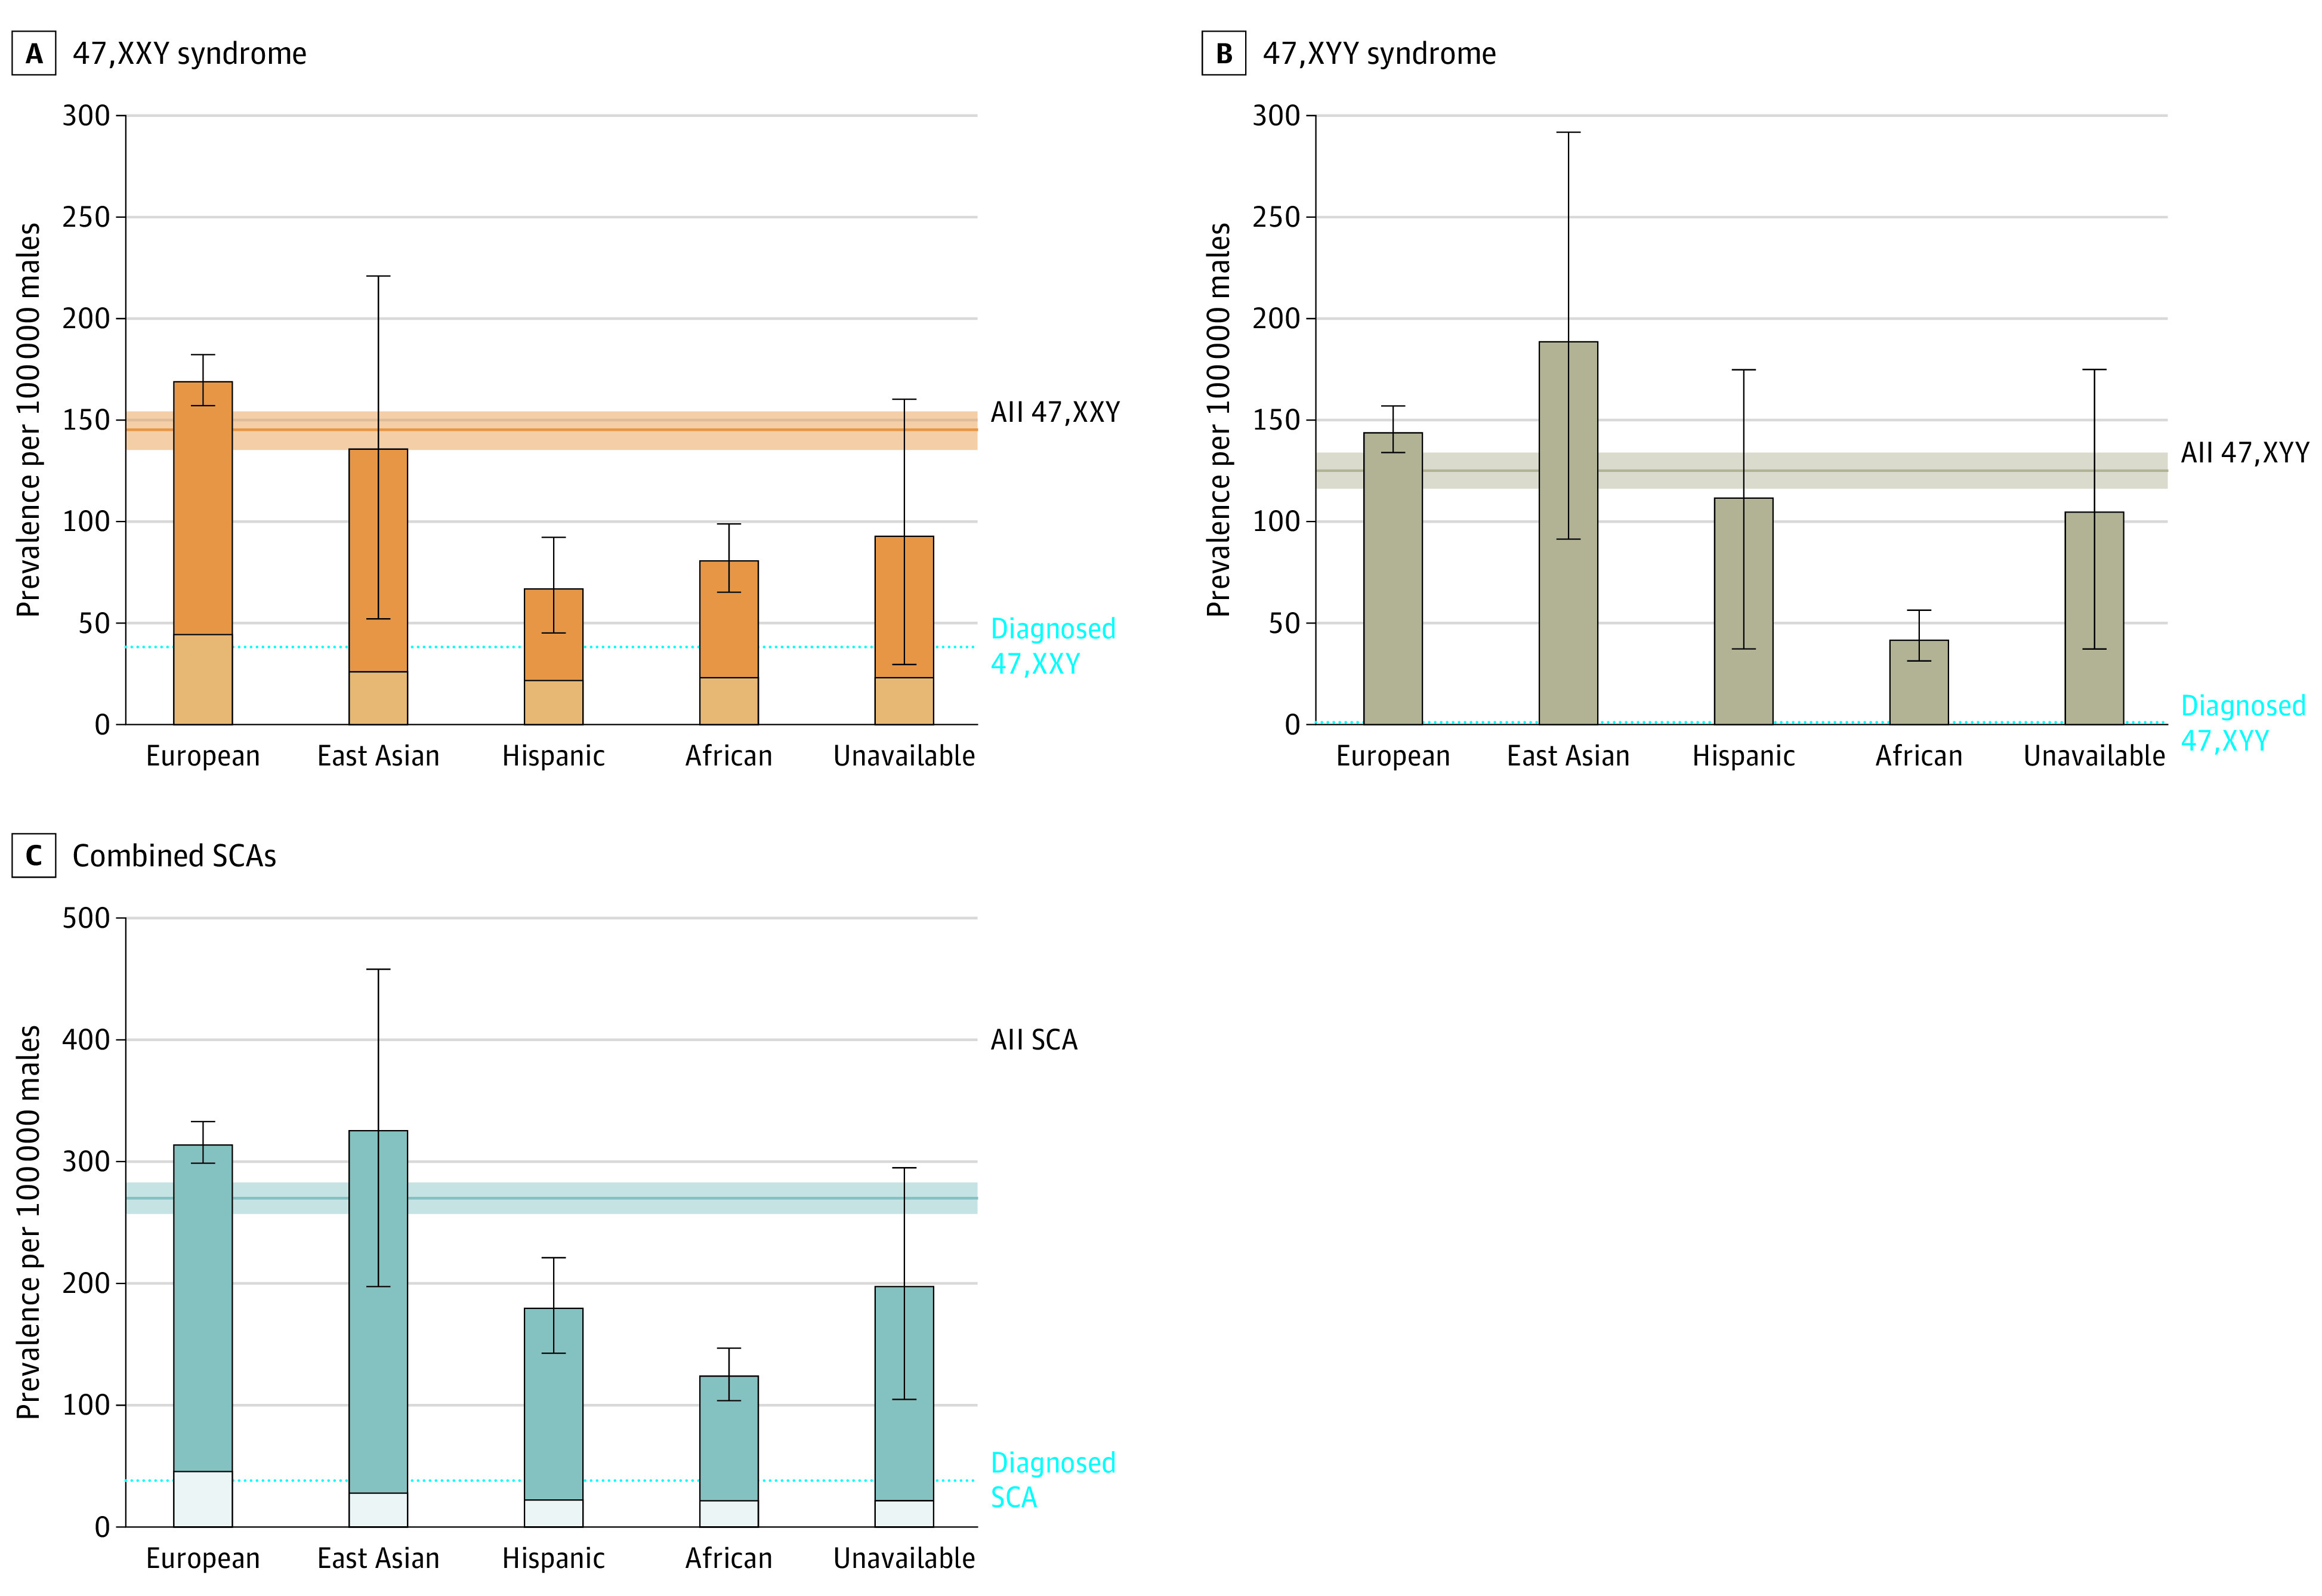
Figure 2. Prevalence of Sex Chromosome Aneuploidy (SCA) Stratified by Genetic Ancestry.

The bars and error bars represent the calculated prevalence and 95% confidence interval (CI) for each genetic ancestry group. The horizontal line and shaded area represent the calculated prevalence and 95% CI overall. The lighter shaded areas within the bars represent individuals with a clinical diagnosis in their electronic medical record.
