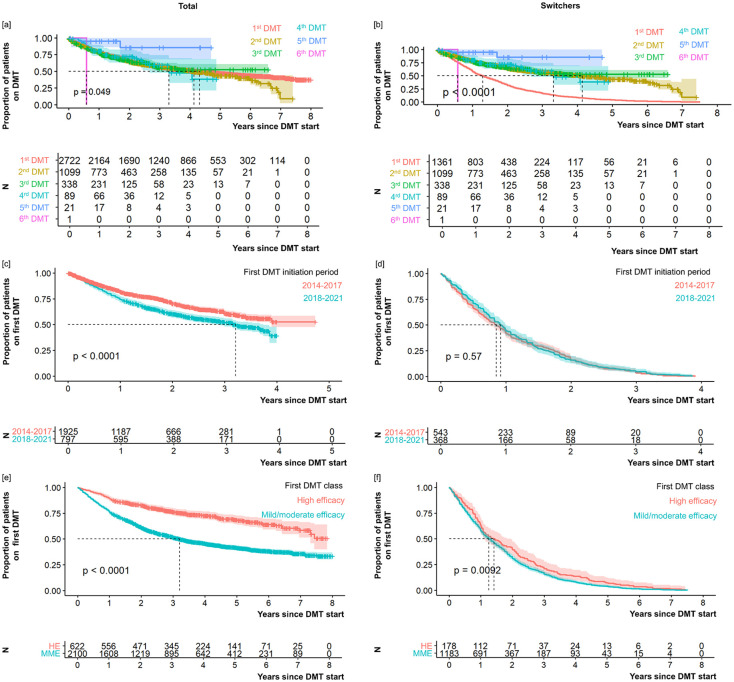
Figure 5.
Treatment duration with regard to the number of DMT switches (a, b), the period of the first DMT (c, d), and the efficacy category of the first DMT (e, f). Graphs show proportions (upper graph parts, respectively) and numbers (lower graph parts, respectively) of patients (left: total study population of 2722 PwMS; right: 1361 switchers) being on DMT (y-axis) across time following DMT initiation (x-axis), visualized as survival curves. The treatment duration mainly varies, particularly for the initial switch (total study population: p = 0.049; switchers only: p < 0.0001), while the retention time for subsequent DMTs is comparable. Furthermore, survival curves revealed a discontinuation of DMT after shorter treatment duration in patients who initiated their first DMT between 2018 and 2021 (total study population: p < 0.0001) and in those who received a mild-to-moderate efficacy DMT as first treatment (total study population: p < 0.0001; switchers only: p = 0.0092). The date of the last neurological consultation was chosen as censoring.
DMT, disease-modifying therapy; HE, high efficacy; MME, mild-to-moderate efficacy; MS, multiple sclerosis; N, number of patients; p, log-rank p-value; PwMS, people with MS.

