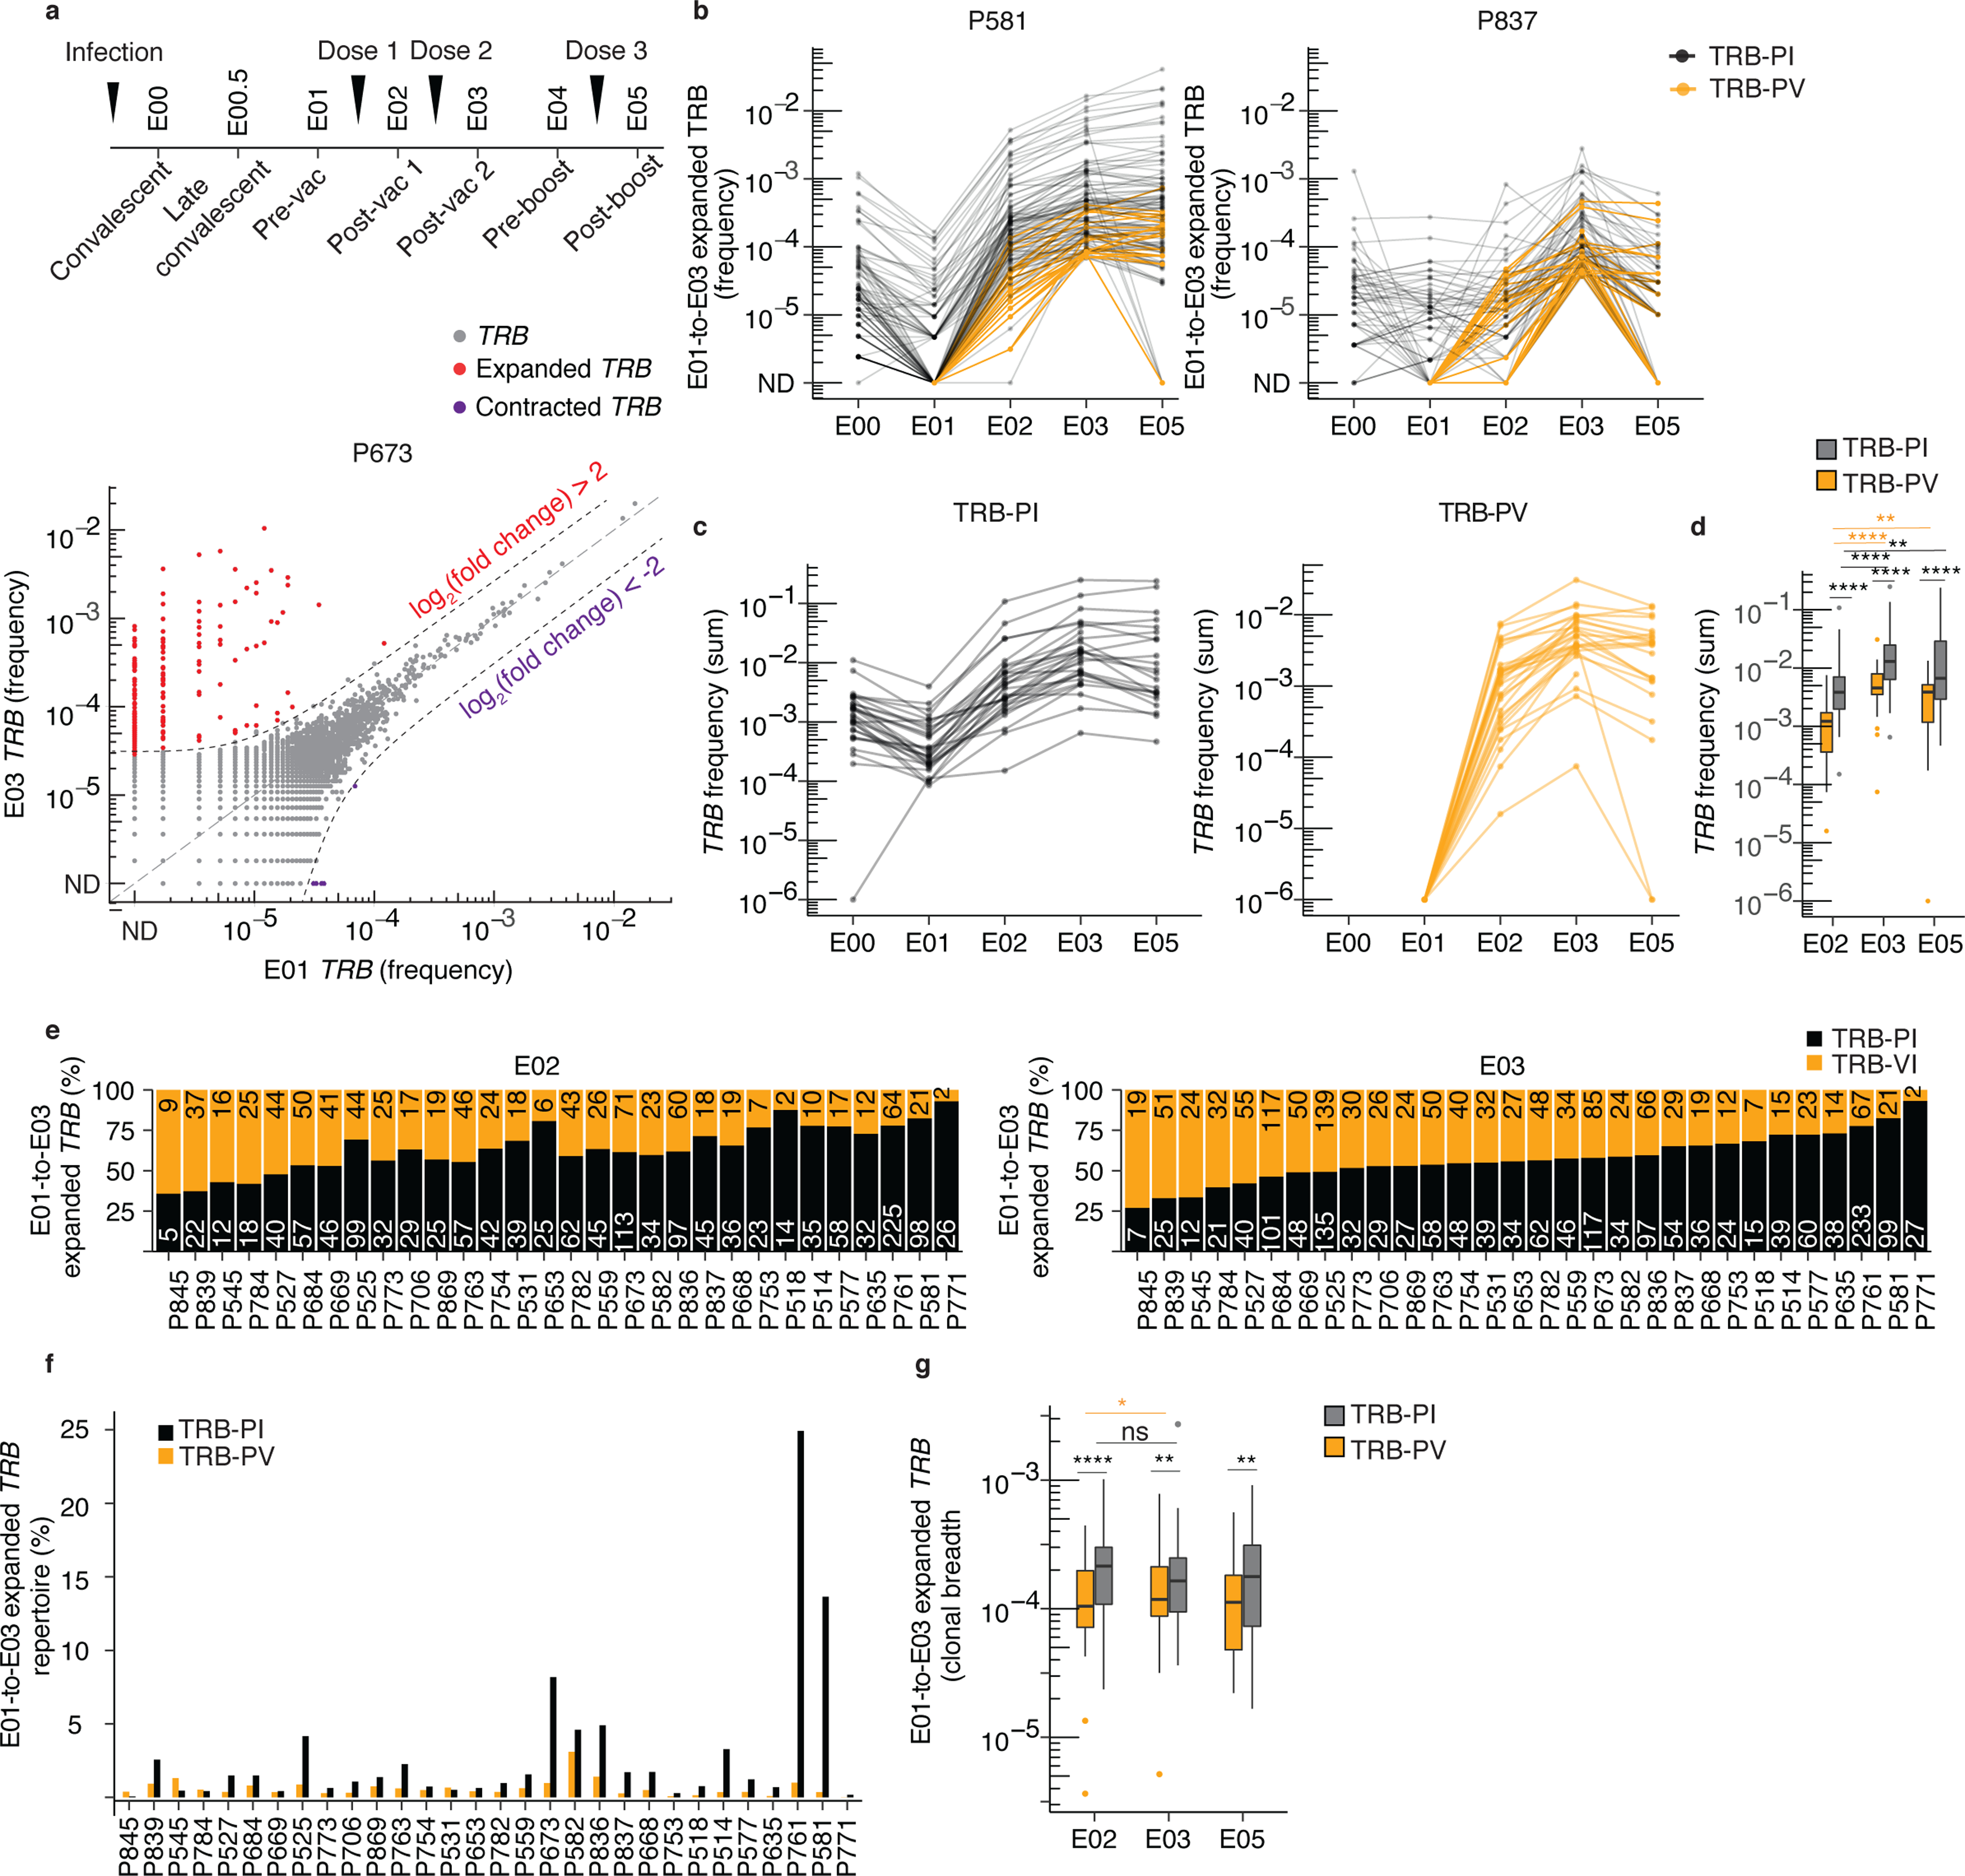
Fig. 1. Vaccines expand previously detected and low abundance clonotypes.

(a) Timing of PBMC sampling and frequency (fraction of the bulk TRB repertoire) of individual clonotypes in E01 vs. E03 in one representative participant (P673). Expanded clonotypes were defined as log2(fold change) > 2 (or < 0.5) and Fisher’s exact test FDR-adjusted p value < 0.05. (b) Frequency of E01-to-E03 expanded clonotypes from E00 through E05 in two representative participants (P581 and P837). (c) Sum of E01-to-E03 expanded TRB clonotype frequency (abundance) per participant detected at E00 and E01 (post-infection TRB clonotypes, TRB-PI) or detected exclusively starting at E02 (post-vaccination TRB clonotypes, TRB-PV, n = 28). (d) Comparison of abundance of E01-to-E03-expanded TRB-PI and TRB-PV at E02 (n = 30), E03 (n = 30) E05 (n = 28) relative to E01. (e) Number of unique E01-to-E03 expanded TRB-PI and TRB-PV clonotypes detected at E02 (post-dose 1) and E03 (post-dose 2), ranked by fraction of repertoire present at E03. (f) Breadth of E01-to-E03-expanded TRB-PI and TRB-PV clonotypes at E02 (n = 30), E03 (n = 30) and E05 (n = 28). (g) The percent of total E01-to-E03-expanded TRB clonotypes detected at E02 (n = 30), E03 (n = 30) and E05 (n = 28).d, f, g, level of statistical significance by Wilcox rank sum test between groups or Wilcoxon signed-rank test within groups between time periods is indicated: ns = not significant, *p<0.05, **p<0.01, ****p<0.0001. Box plots represent median, IQR, and whiskers (1.5 * IQR). All tests are two-sided.
