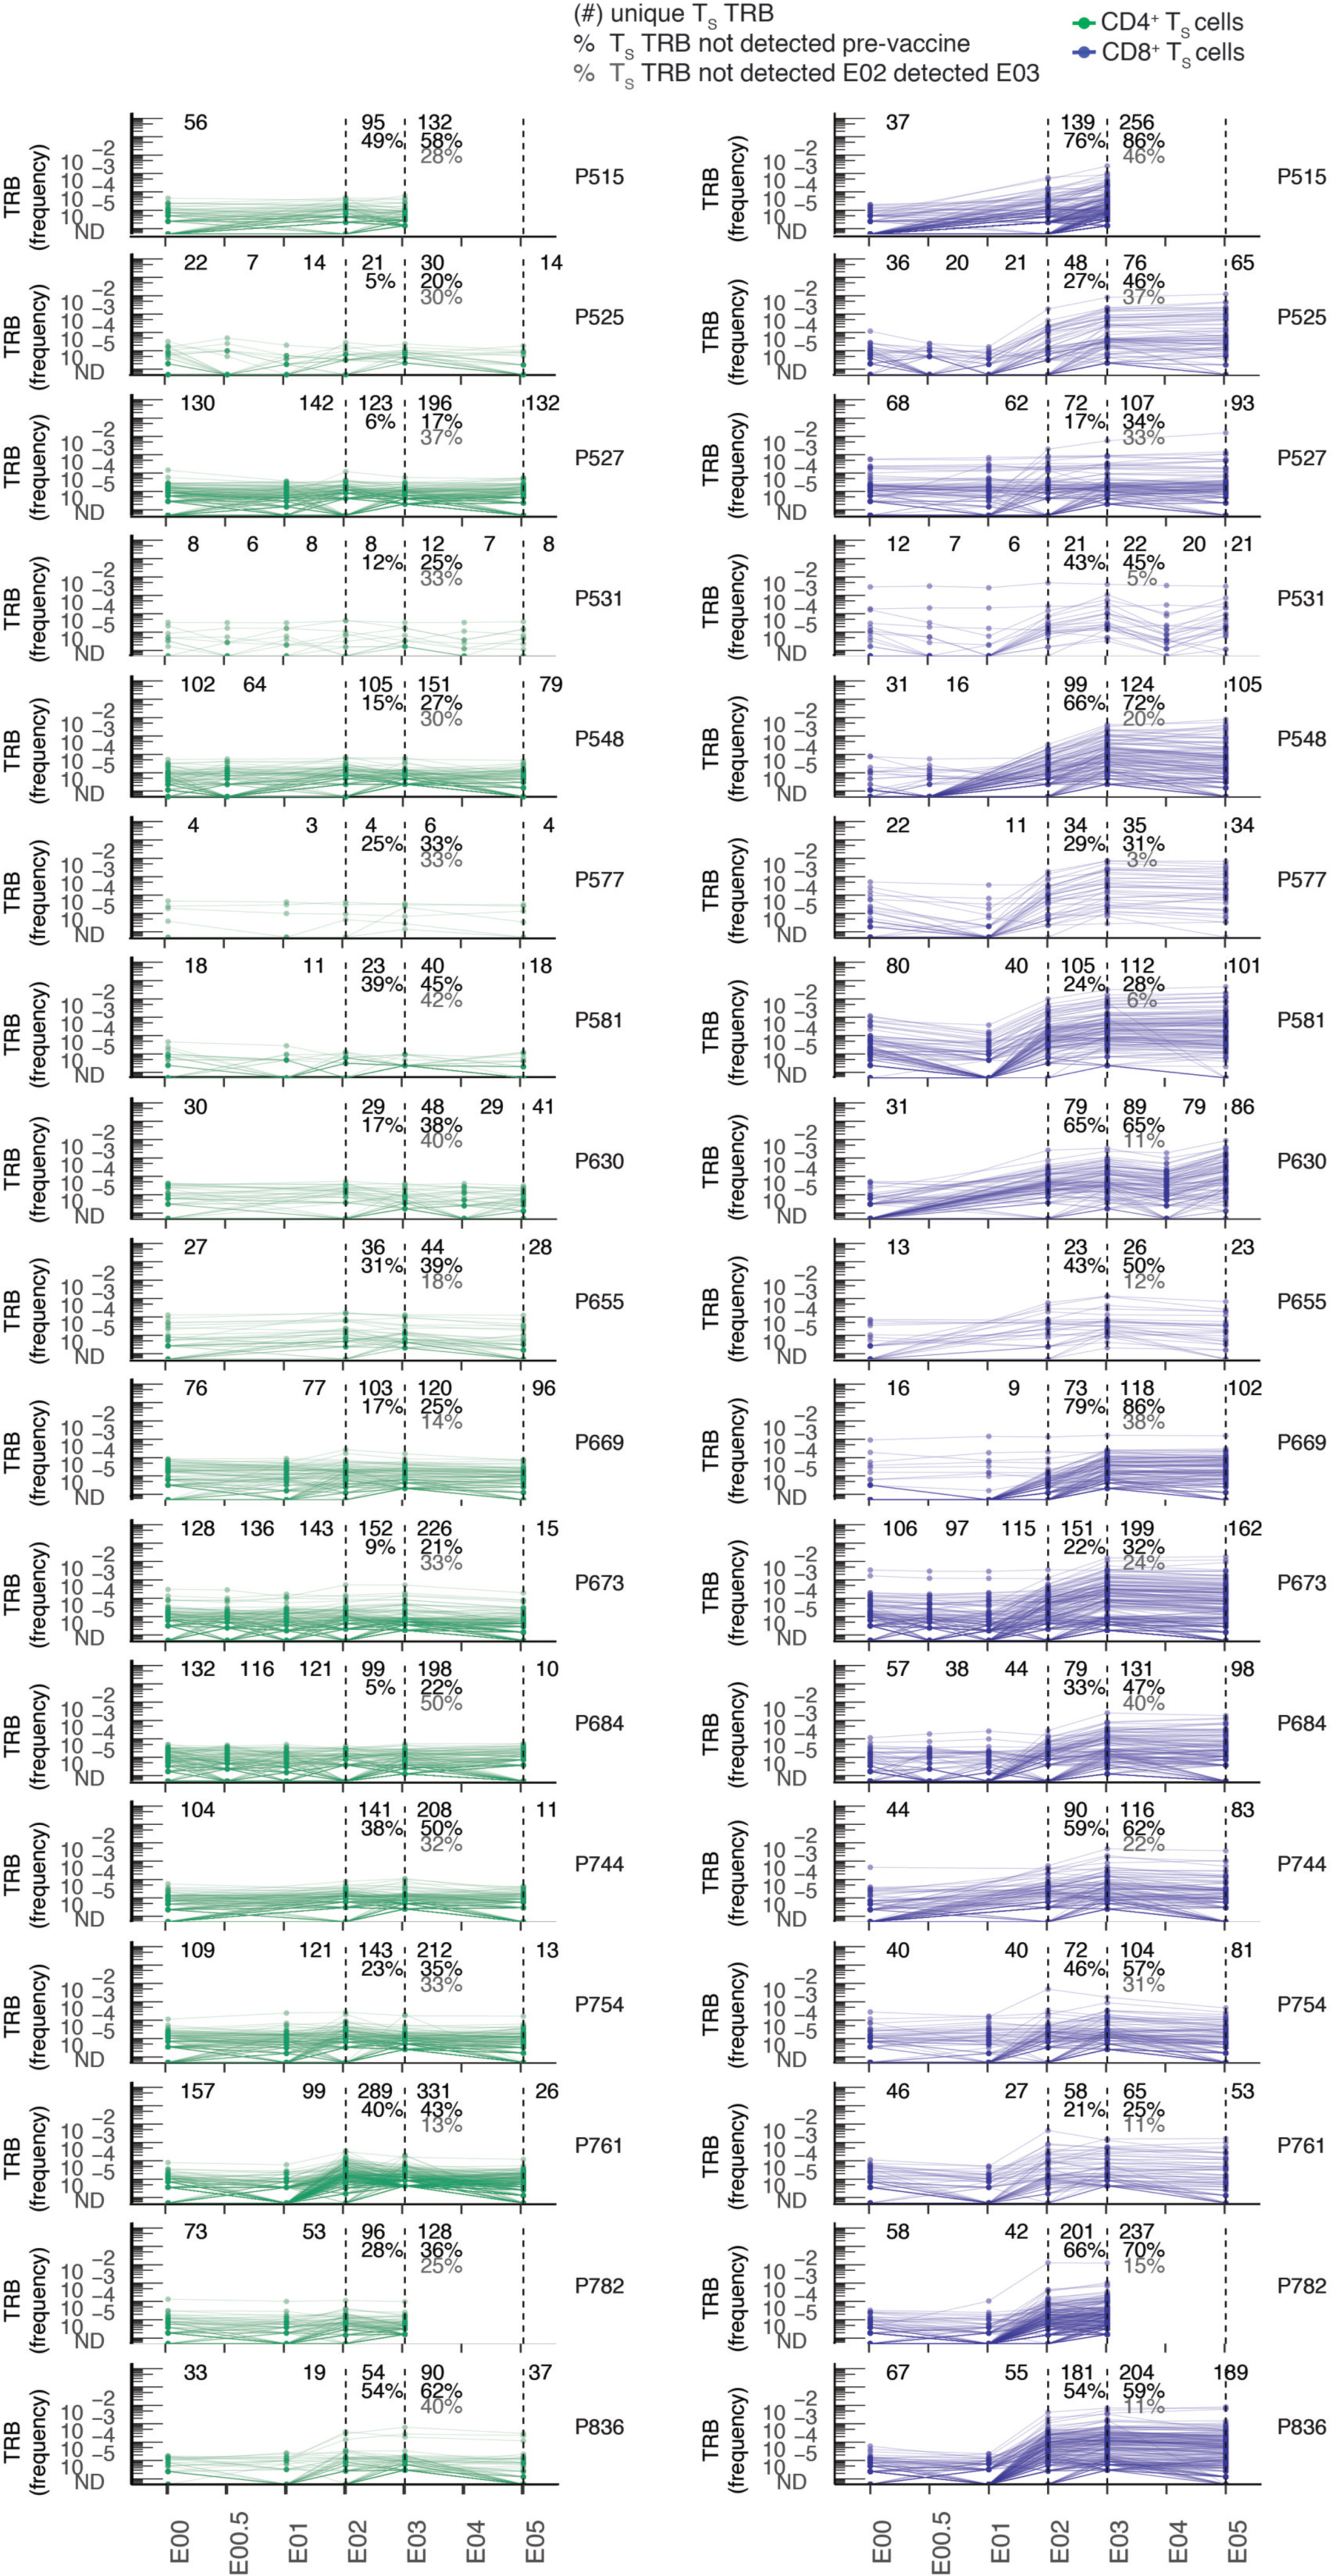
Extended Data Fig. 7. Abundance of TS clonotypes by TCRβ-seq over time.

Longitudinal tracking of abundance of CD69+CD137+ AIM-scTCRɑβ-seq-identified CD4+ and CD8+ TS TRB clonotypes in PBMC by TCRβ-seq in all participants with AIM-scTCRɑβ-seq. Numbers in top rows indicate the number of unique CD69+CD137+ AIM-scTCRɑβ-seq TRB clonotypes from E03 detected at each time point. Percentages refer to the fraction of CD69+CD137+ AIM-scTCRɑβ-seq clonotypes detected at the E02 and E03 timepoints, respectively, detected only post-vaccination. Percentages in gray are the fraction of unique clones detected at E03 that are below the level of detection at E02. Not all participants had samples at each time point, indicated by absence of dot symbols at those samples. Participant P669 had SARS-CoV-2 infection between E03 and E05 timepoints and so this E05 repertoire reflects repeat SARS-Co-2 infection and mRNA booster vaccine.
