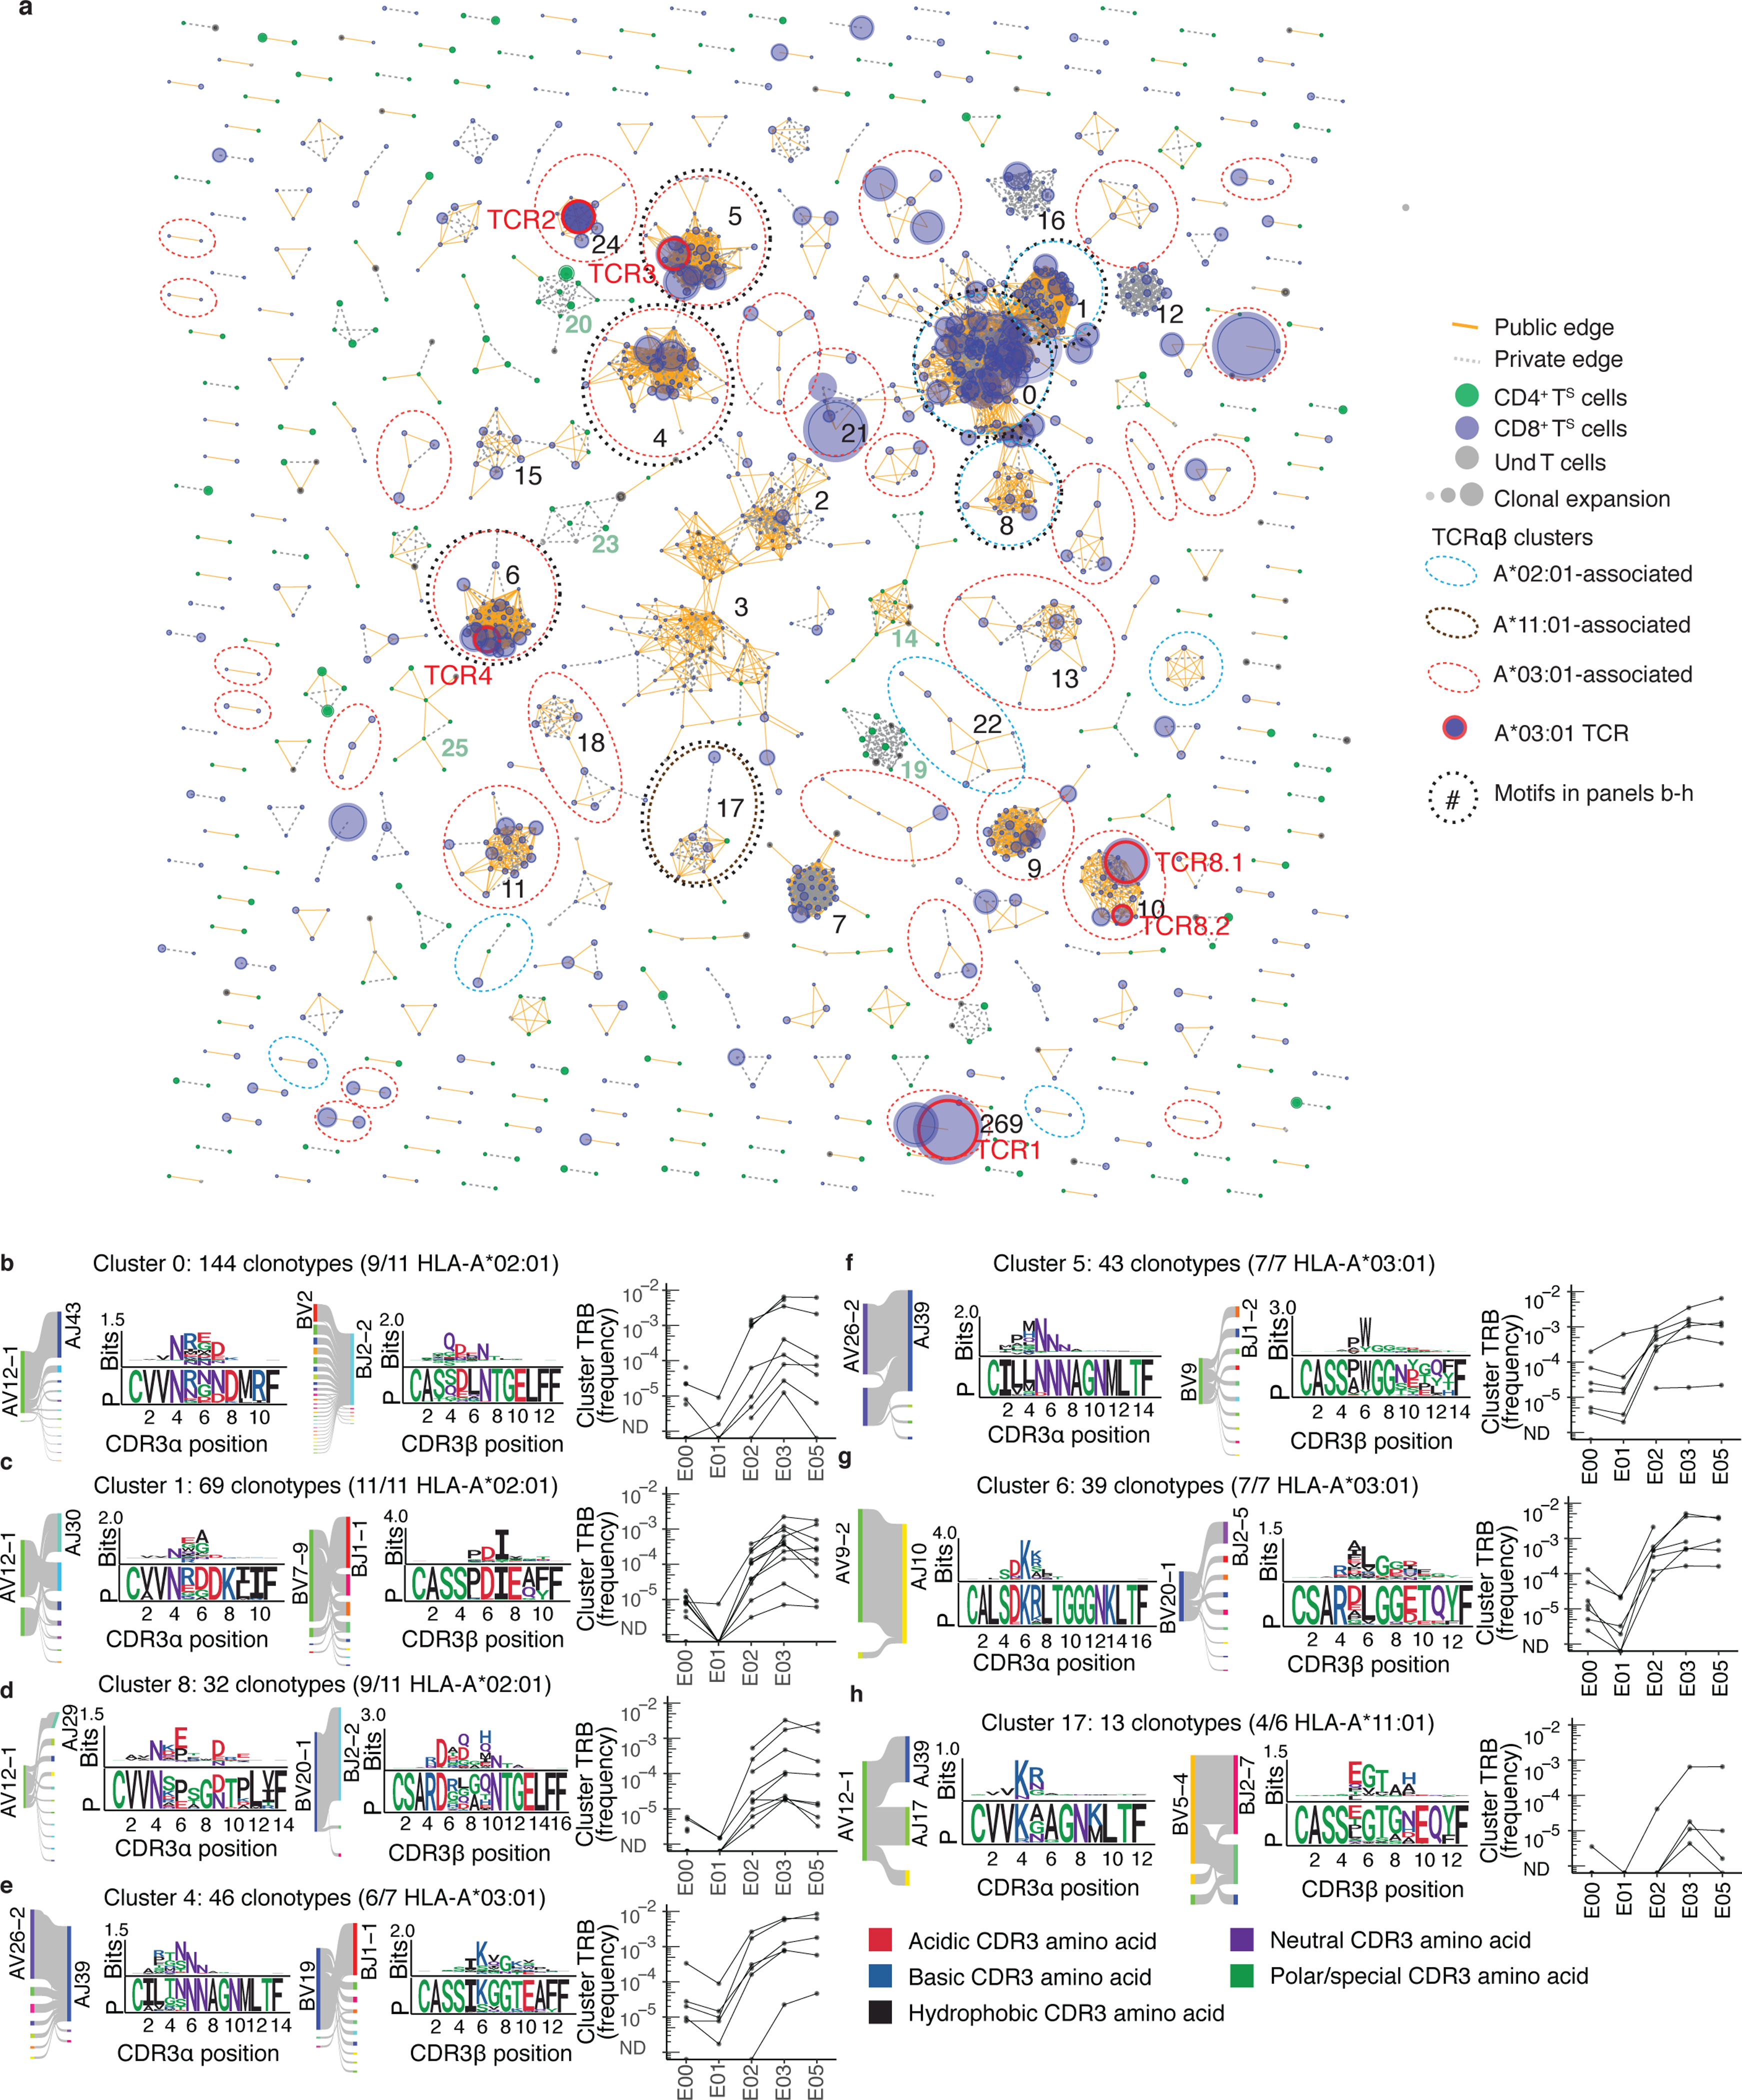
Fig. 4. TCRαβ sequence similarity network shows public CD8+ T cell responses among sequences recovered by AIM-scTCRɑβ-seq.

(a) Sequence similarity graph with 1448 paired TCRɑβ clonotypes and 248 convergent CD8+ T cell and CD4+ T cell clusters of two or more S-reactive clonotypes recovered from 17 persons at E03. Edges are formed between similar receptors (TCRdist ≤ 100). Edges indicate connections between TCRs observed in multiple or single participants. Circle size represents the relative frequency of each TCRαβ clonotype. Equivalent TCRαβ amino acid sequences may be included more than once if found in multiple participants. (b-h) Logo plots for representative clusters indicated by integers in (a) with inferred restricting HLA class I alleles (see Methods) and number of participants contributing to each cluster with the matching HLA allele, and graphs showing the sum of clonal frequency of the TRB sequences in each cluster in longitudinal PBMC repertoires for each participant. For each CDR3 motif, the lower sequence logo shows the probability of each amino acid residue at each CDR3 position, and the upper sequence logo depicts the information content in bits comparing the residue usage to a set of randomly selected CDR3 with the same V and J gene usage as the sequence cluster (Methods).
