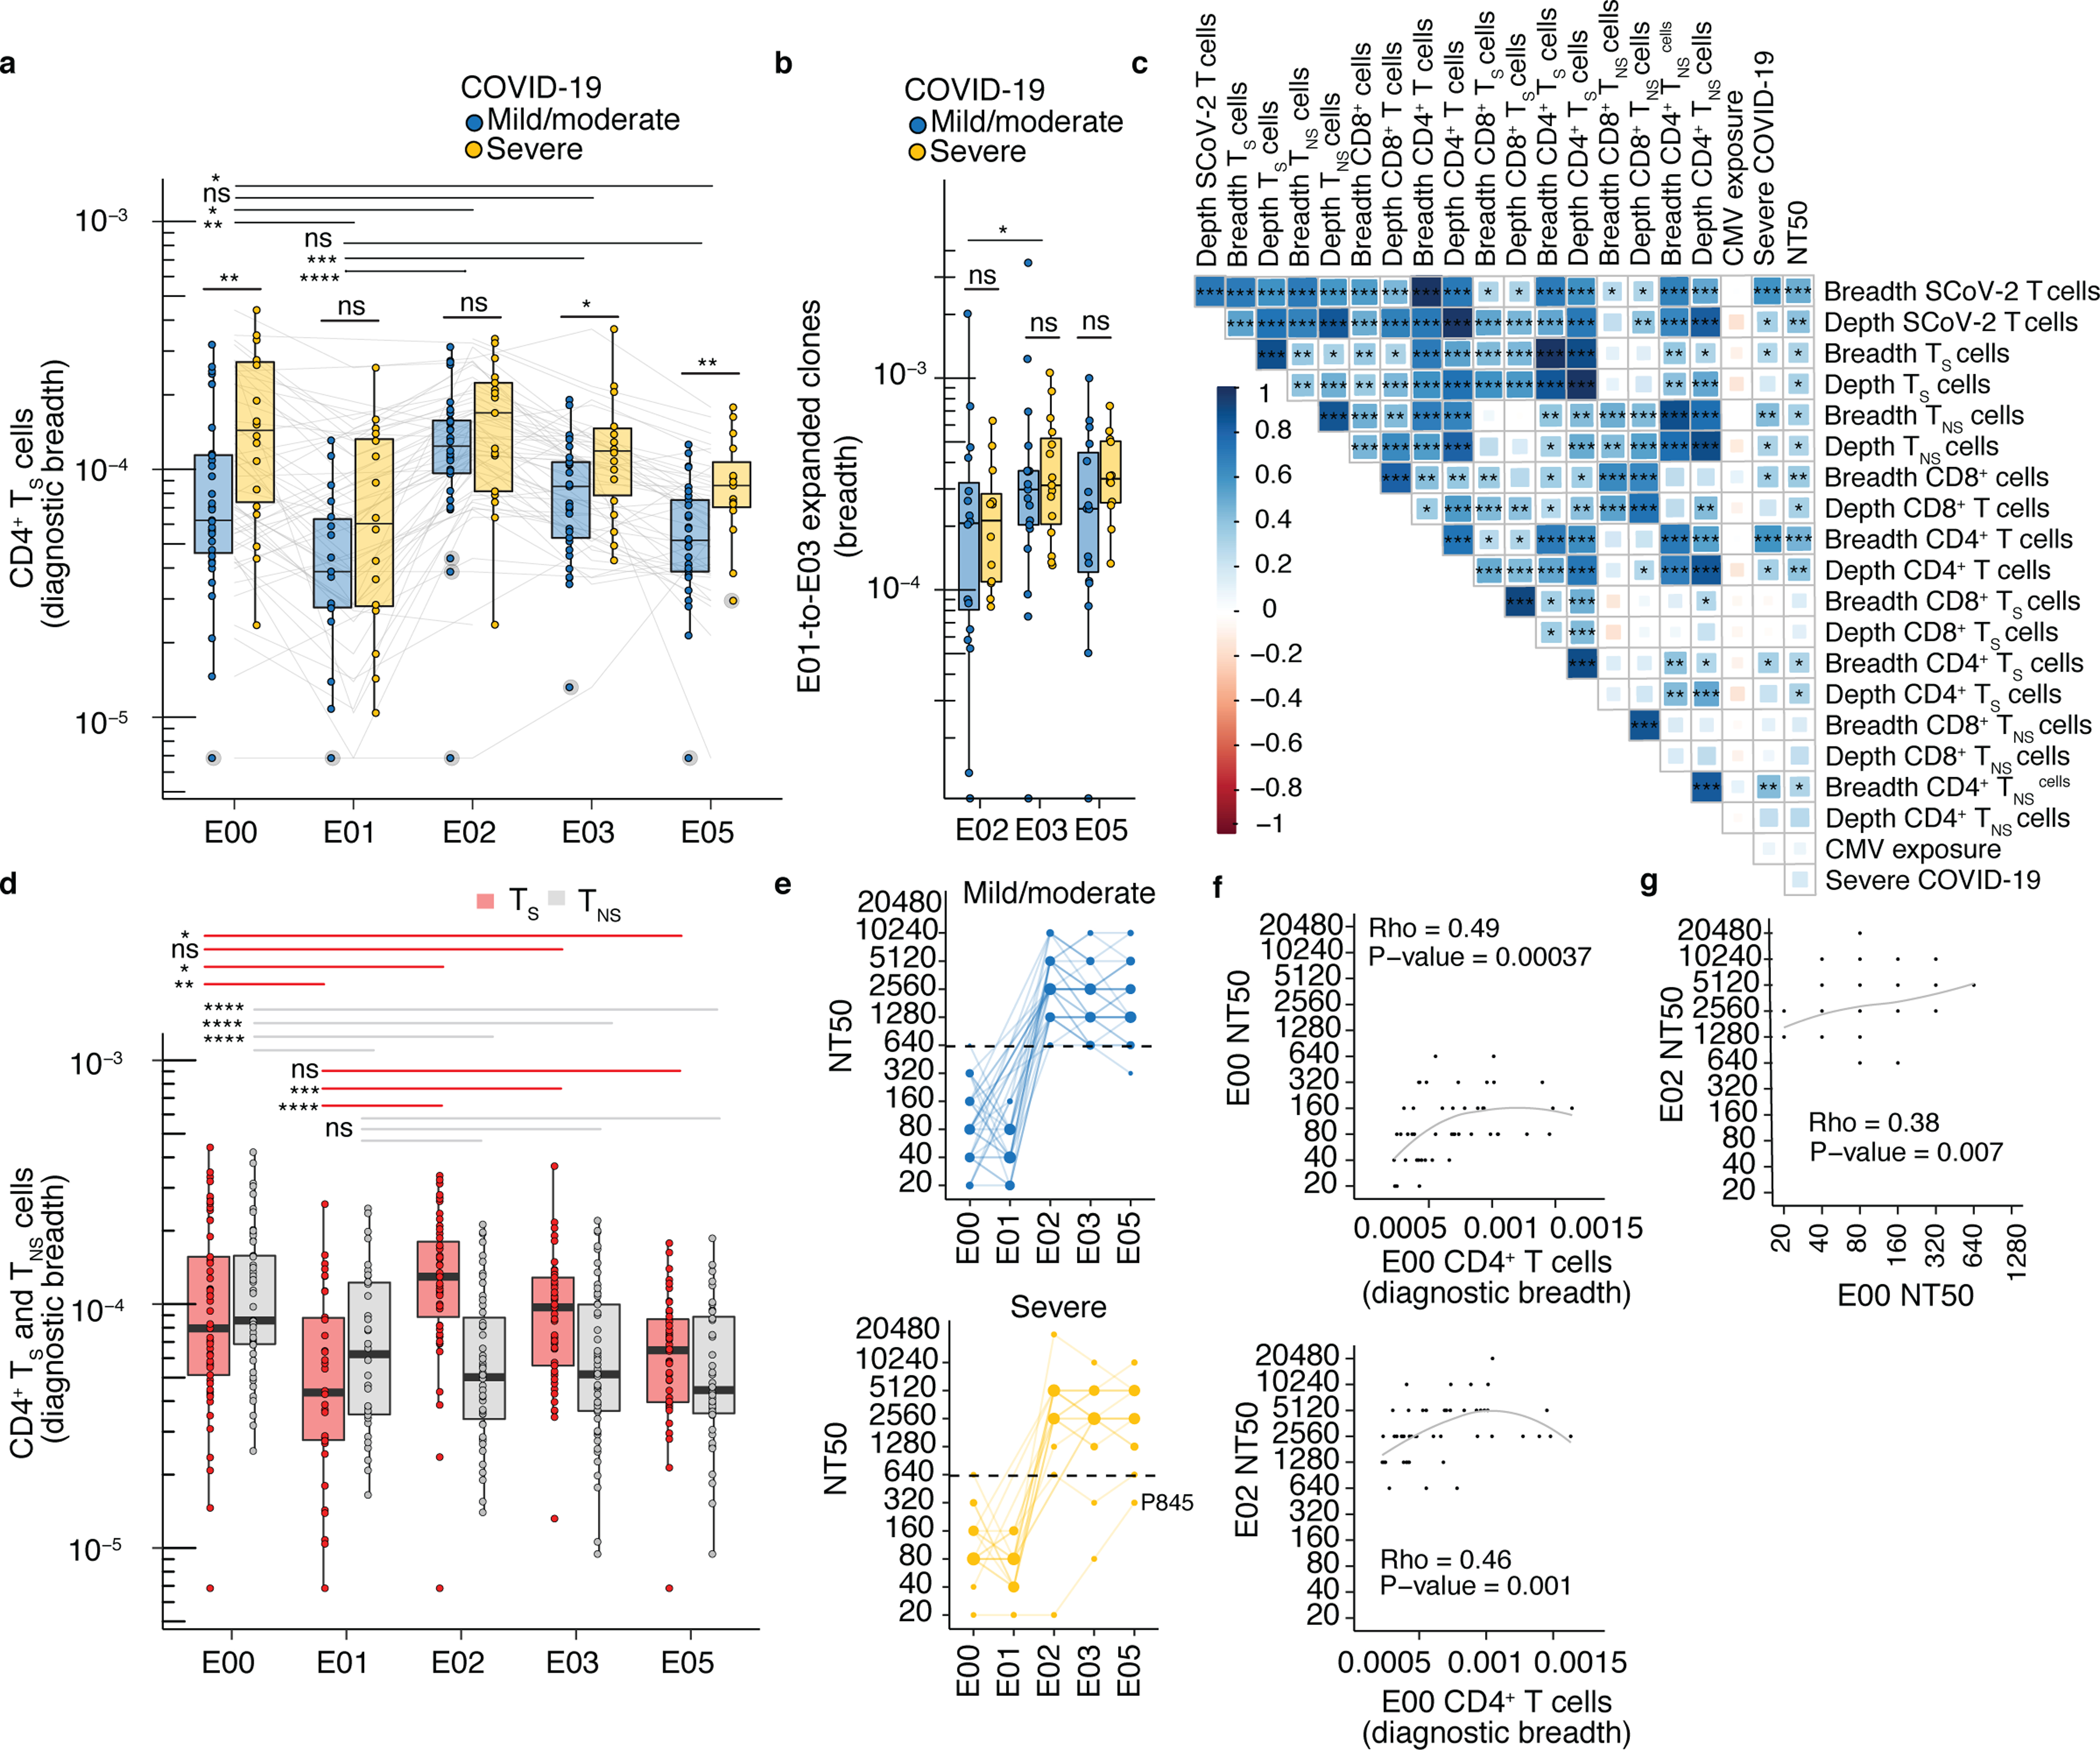
Fig. 6. TRB sequence-defined metrics and nAb associate with disease severity before and after mRNA vaccination.

(a) Comparison of diagnostic CD4+ TS breadth (Methods) between participants with mild/moderate COVID-19 at E00 (n=35), E01 (n=18), E02 (n=35), E03 (n=35), E05 (n =29) and severe COVID-19 at E00 (n=19), E01 (n=16), E02 (n=17), E03 (n=18), E05 (n=15)). (b) Breadth of E01-to-E02, E01-E03 and E01-E05 expanded clonotypes in mild/moderate COVID-19 at E02 (n=17), E03 (n=18), E05 (n=16), and severe COVID-19 at E02 (n=12), E03 (n=15), E05 (n=12). (c) Rank correlation of diagnostic sequence-defined metrics (S, spike; NS, non-spike) with severity and neutralization titers (NT50) at E00 (n = 51). CMV exposure was imputed from TRB repertoire (Methods). Shading, strength of correlation (ρ correlation coefficient); asterisks, level of statistical significance. (d) Breadth of inferred CD4+ TS and TNS TRB sequences from PBMC at E00 (n=54), E01 (n=34), E02 (n=52), E03 (n=53), E05 (n=44). (e) NT50 of serum antibodies in mild/moderate (n=35) and severe COVID-19 (n=19) at E00, E01, E02, E03, and E05). (f) Association of CD4+ T cell diagnostic breadth at E00 with nAb NT50 at E00 and E02 (n=52). (g) Association between E00 nAb NT50 and E02 nAb NT50 (n=52) in participants with prior SARS-CoV-2 infection. In (a, b, d), tests between time points are paired Wilcoxon signed-rank and between groups with different severity are unpaired Wilcoxon rank-sum. Median, IQR, and whiskers (1.5 * IQR) are shown. Level of two-sided statistical significance is as indicated: ns = not significant, *p<0.05, **p<0.01, ***p<0.001, ****p<0.0001.
