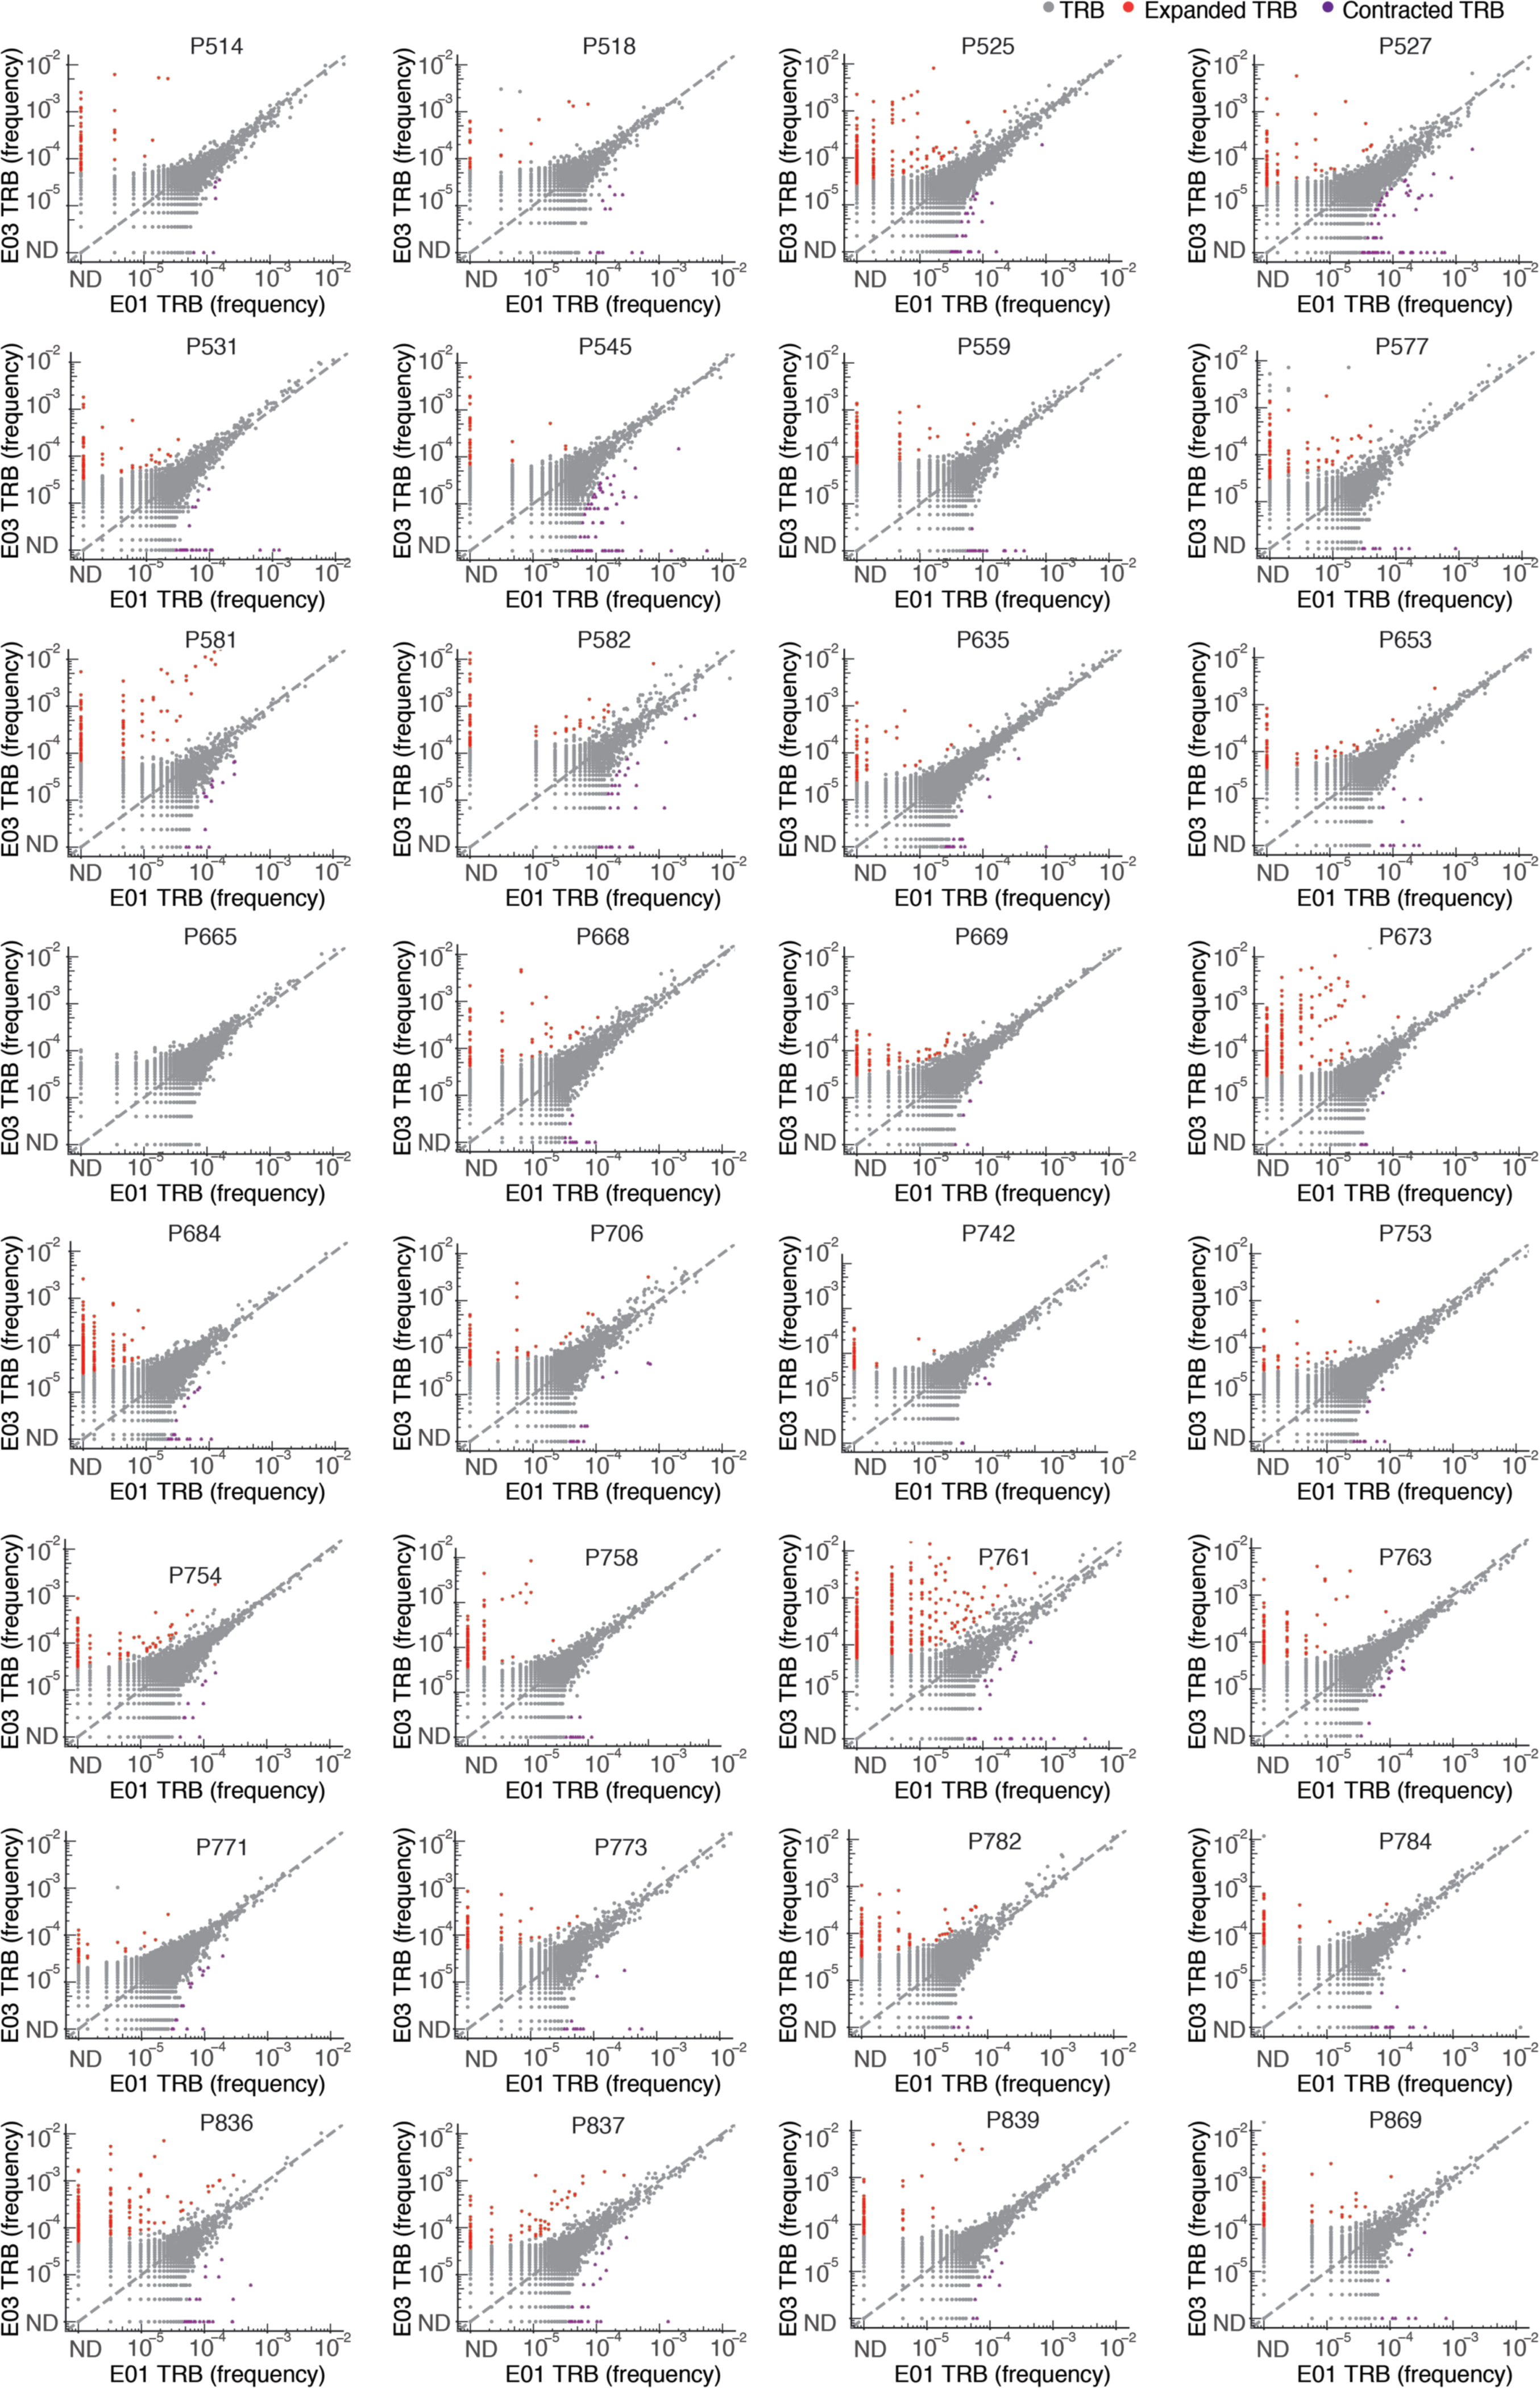
Extended Data Fig. 2. Primary vaccination led to expansion in specific TCR clonotypes in vaccinated persons.

Frequency (% of bulk TRB repertoire) of individual clonotypes in E01 vs. E03 in 32 persons with both samples. Expanded (red) (or contracted, purple) clonotypes were defined as log2(fold change) > 2 (or < 0.5) and Fisher’s exact test FDR-adjusted q value < 0.05. Dotted line indicates y = x. Participant ID at top of each graph. ND = not detected. Serologically-naive Participant P845 is not shown.
