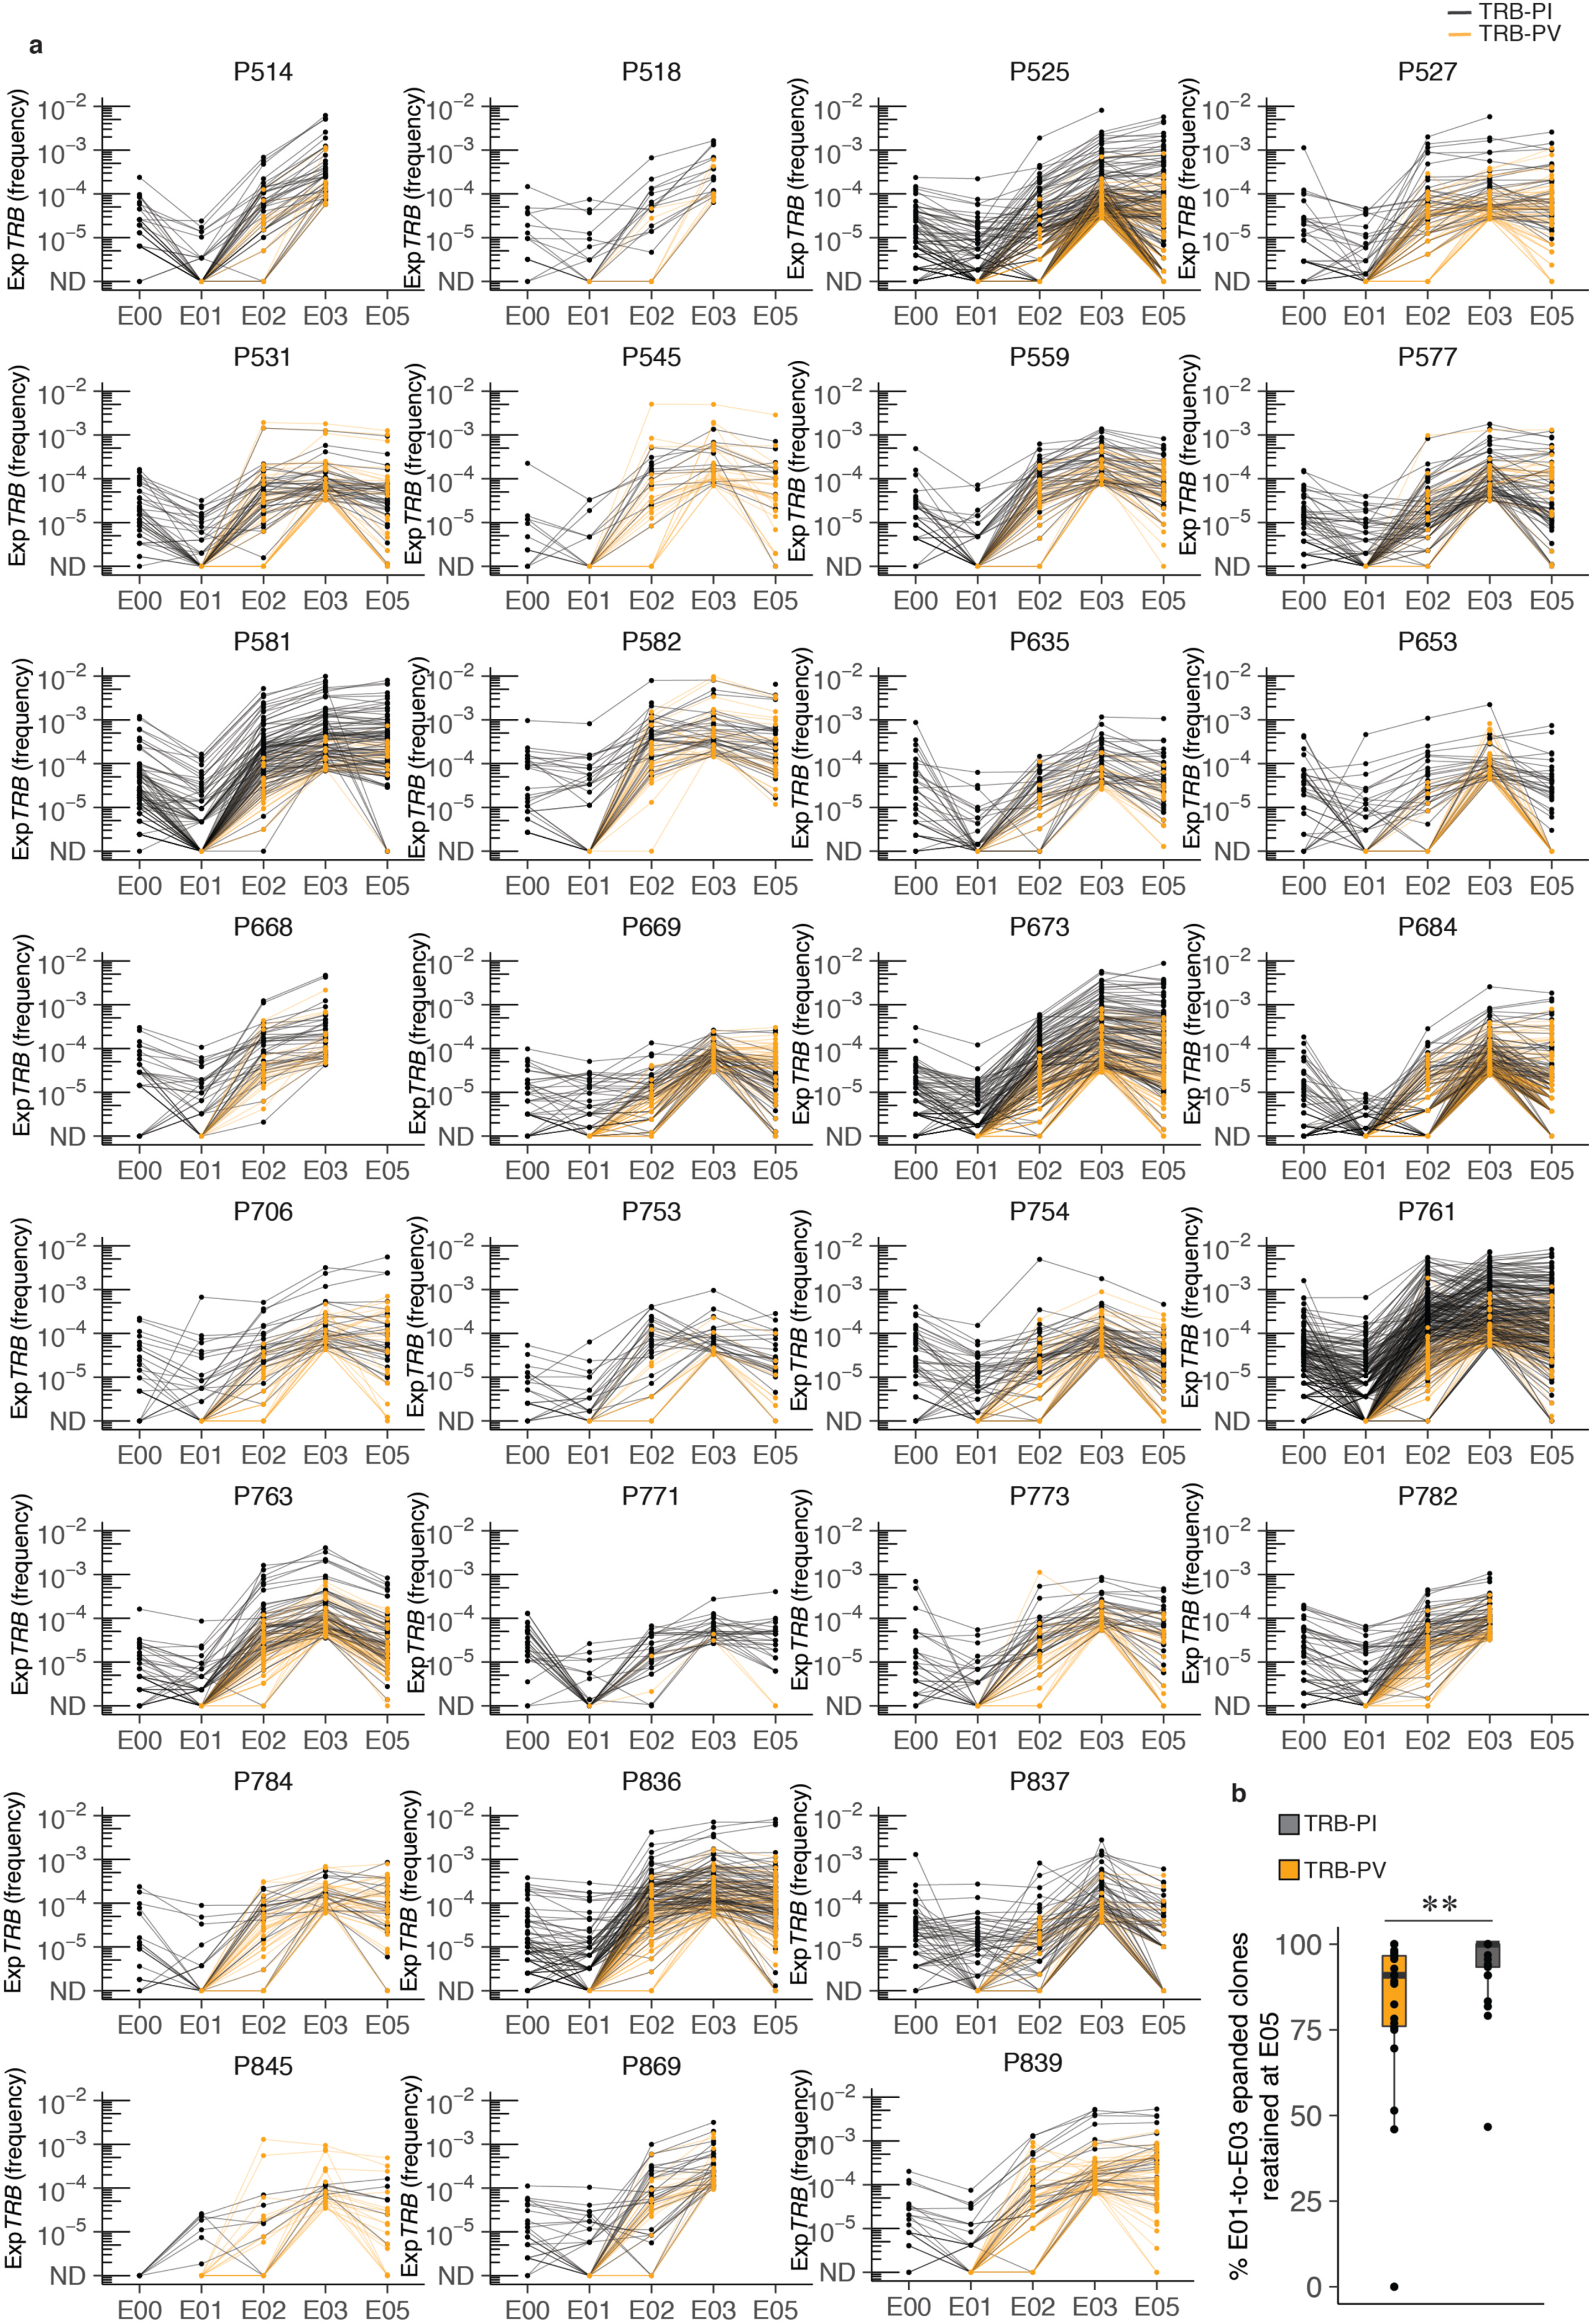
Extended Data Fig. 3. Frequency of E01-to-E03 expanded clonotypes from E00 through E05.

(a) E01-to-E03 expanded clonotype frequency (abundance) over the course of the study. Each line is an individual clonotype. TRB-PI are shown in black, TRB-PV are in orange (n = 30). ND = not detected. (b) Boxplot at lower right shows the percent of TRB-PI and TRB-PV for each participant that were detectable after a 3rd vaccine dose (E05) (n = 26). Median, IQR and whiskers (1.5*IQR) are noted. Comparison between groups is by two-sided Wilcoxon rank sum test, p = 0.0023. Participants P742 and P758 were not sampled at E02 and trajectories are not shown. Participant P665 had no expanded clonotypes and is not shown. Participant P845 was serologically naive at E00. Participants P545 and P669 experienced breakthrough infection between the E03 and the E05 timepoints and so repertoires at E05 represent both repeat natural infection as well as mRNA booster vaccine dose.
