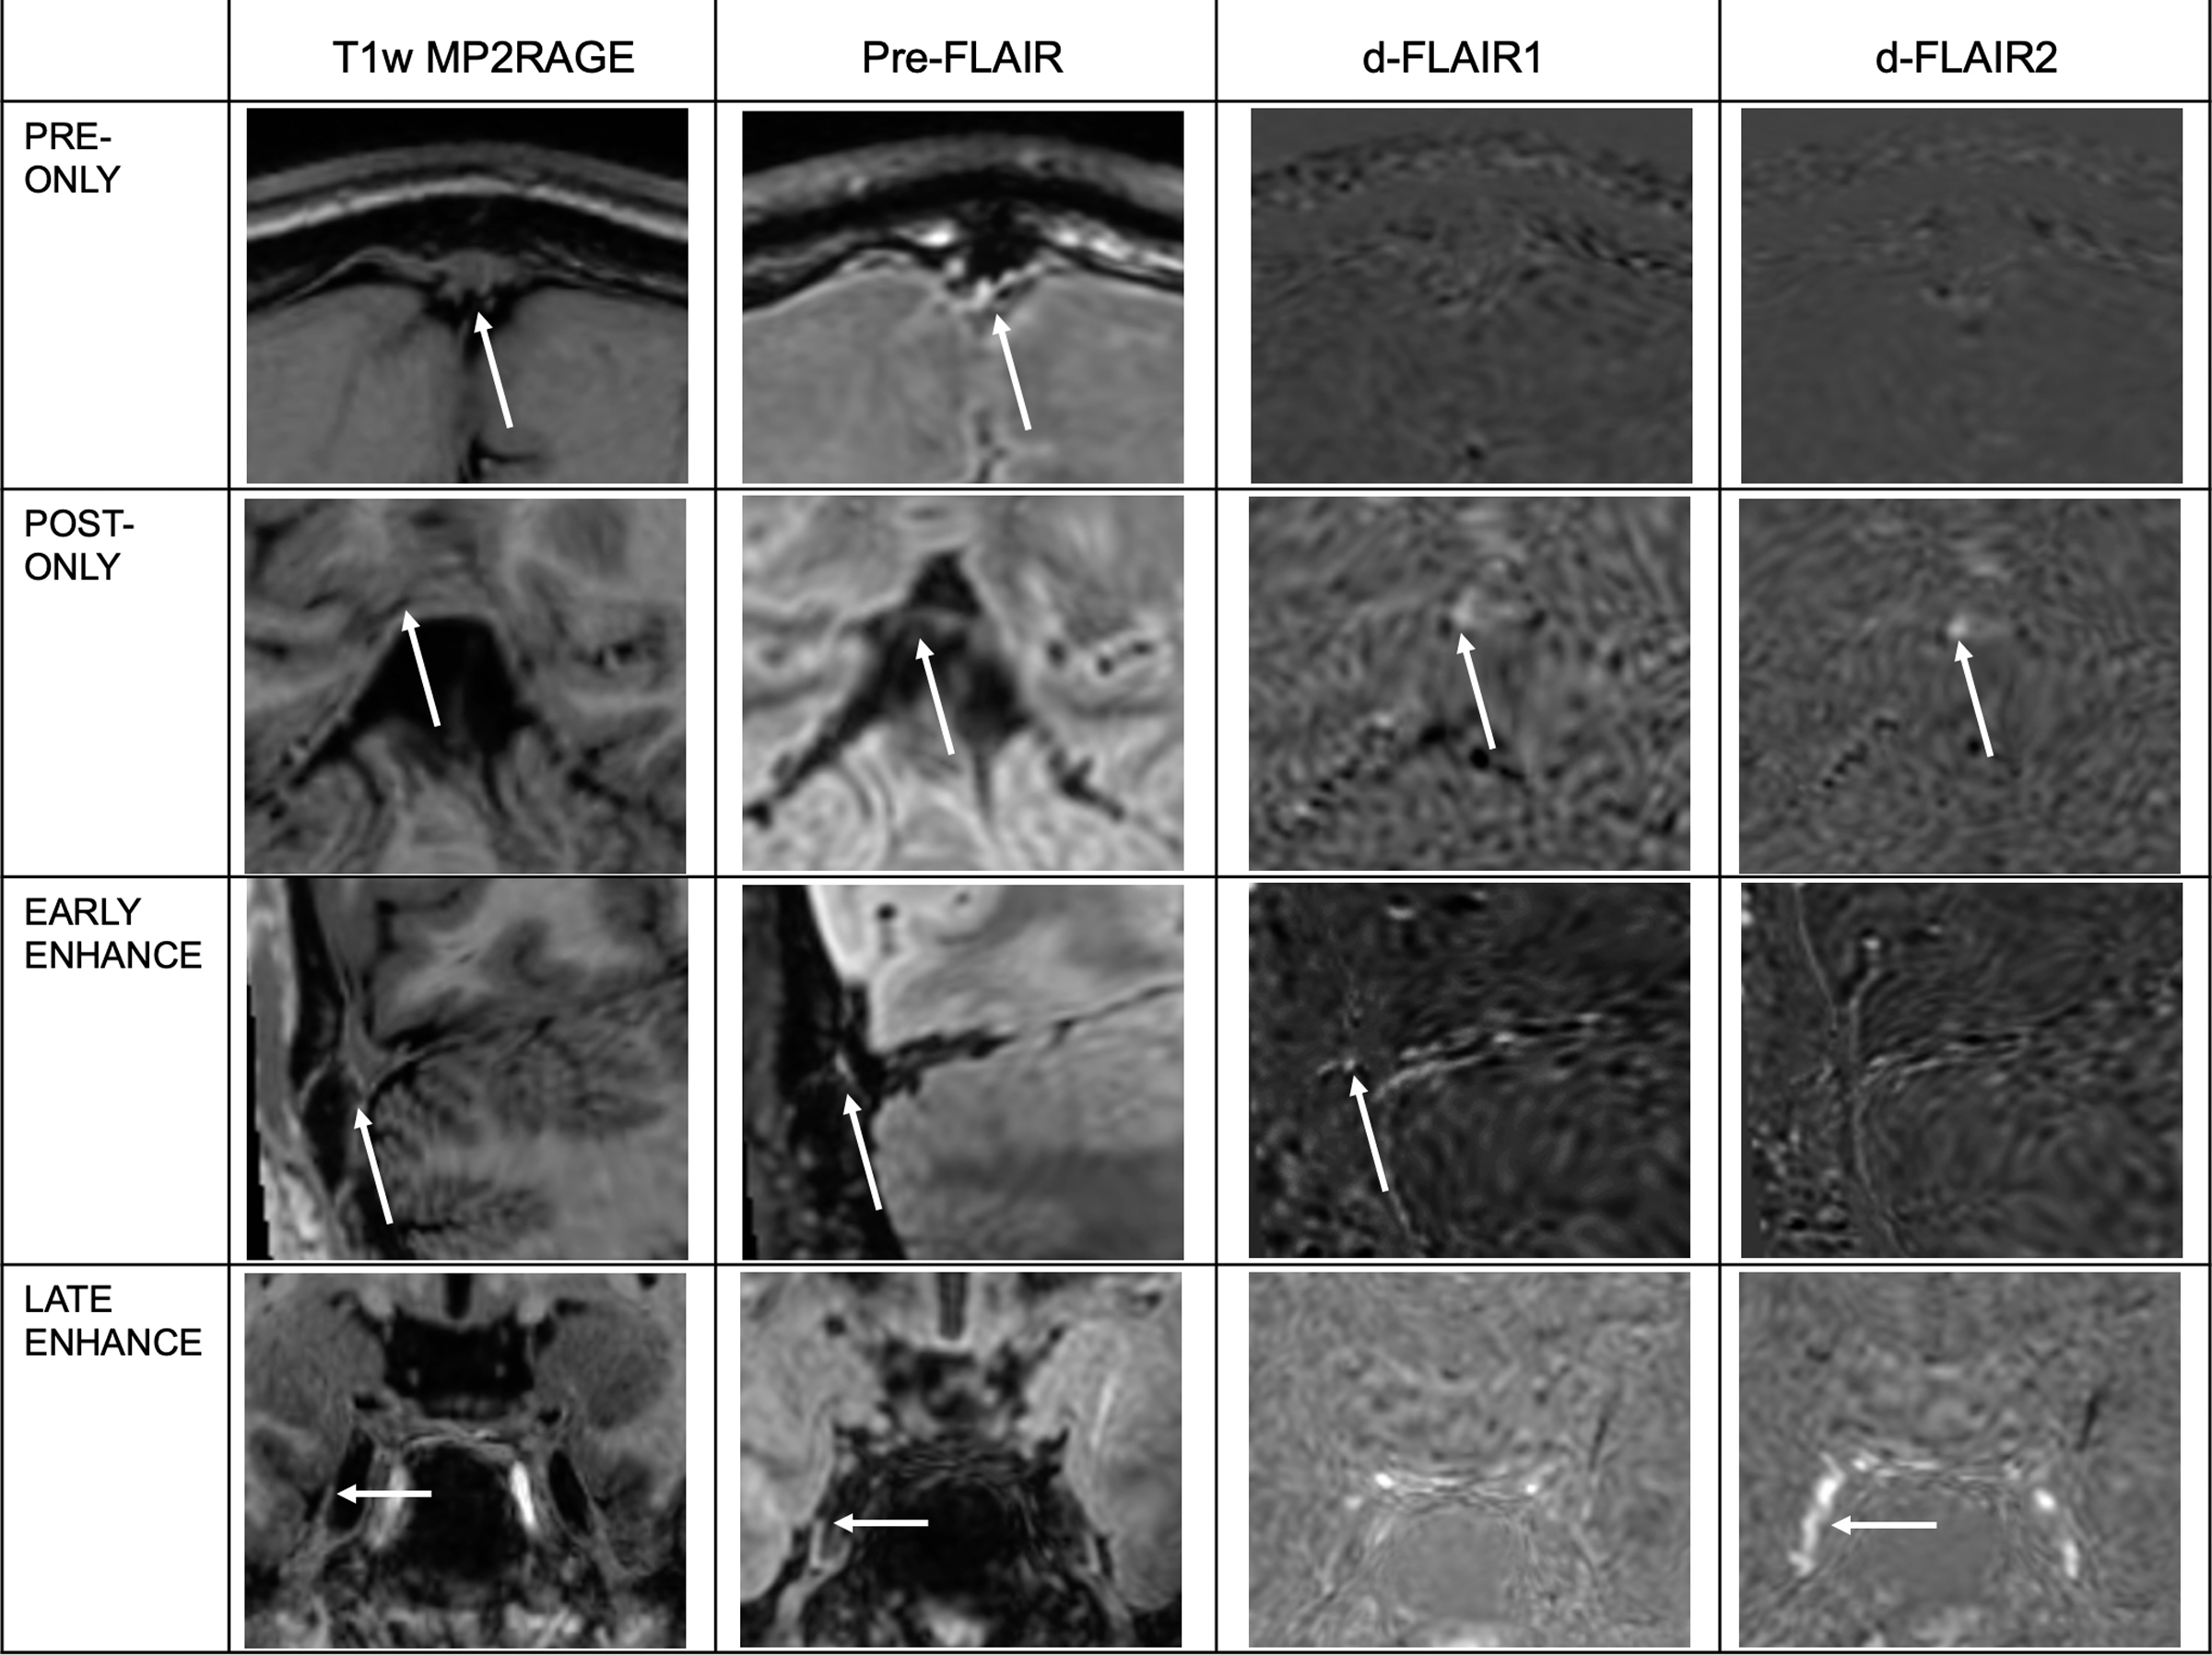
Figure 2.

Examples of observed FLAIR signal characteristics at PMLVs. White arrows denote the location of signal intensity on the Pre-contrast FLAIR sequence (second column), located adjacent to venous structures, or within CSF containing spaces, when localized on the anatomic T1w MP2RAGE sequence (first column). White arrows on subtraction images (d-FLAIR 1 and d-FLAIR2) denote where gadolinium accumulation signal is present. Pre-only, post-only, early and late enhancement signal patterns are illustrated. Fixed enhancement signal pattern is illustrated across various examples in Figure 3. No signal pattern is not shown.
