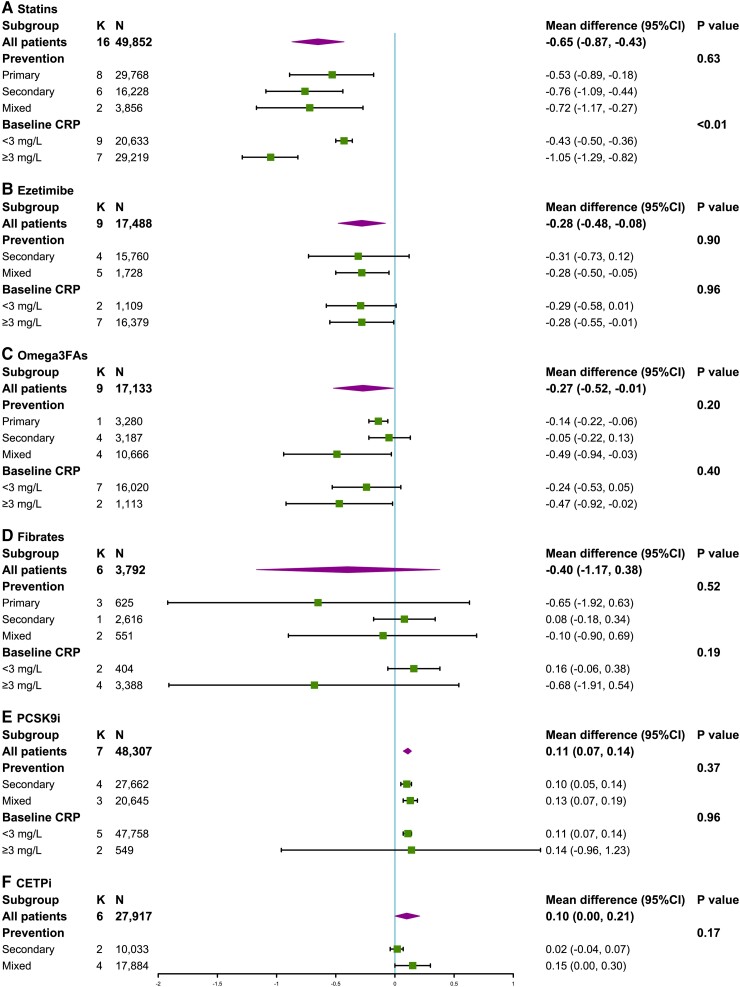
Figure 3.
Forest plots illustrate the different changes in CRP levels among patients in primary CV prevention, secondary CV prevention, or mixed, and patients with low (<3 mg/L) or high (≥3 mg/L) CRP levels at baseline in each drug class. The results are shown in absolute change (mg/L). Only LLTs with more than one trial in at least two subgroups were subjected to subgroup analysis (bempedoic acid was not eligible). CETPi were not included in the subgroup analysis by baseline CRP levels as in all the trials patients had a baseline CRP <3 mg/L. CI, confidence interval; K, number of included trials; N, number of participants.

