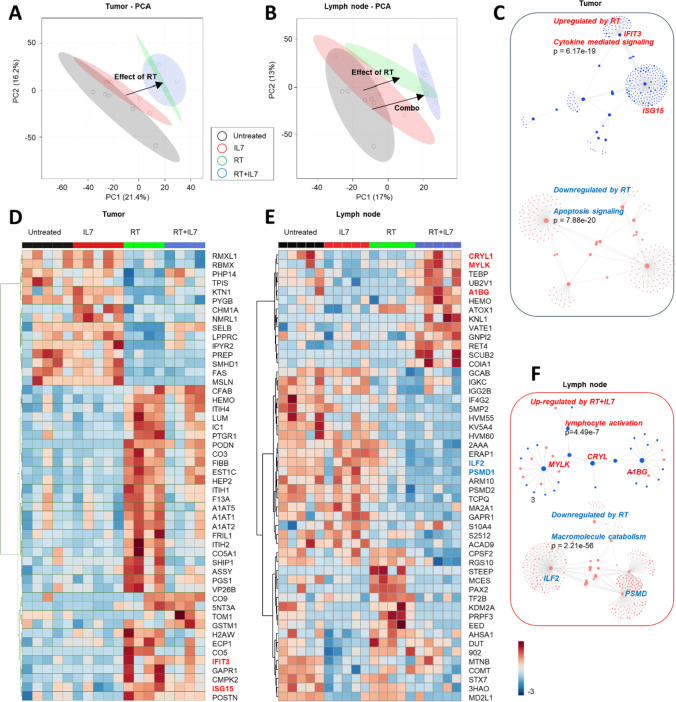
Fig. 3.
Proteomics shows early activation of lymphocytes occurs in draining lymph node. A–B Principal component analysis (PCA) of tumor proteomics (A) and lymph node proteomics (B) with untreated, IL7, RT, and RT + IL7 groups (n = 5 per group). Black arrows indicate the effect of each treatment. C, F Network analysis of pathways that are up- and down-regulated in the tumor (C) and the lymph node (F). Interferon-related gene products IFIT3 and ISG15 were among the most significantly up-regulated nodes in the tumor, and proteins involved in lymphocyte activation, such as MYLK, CRYL and A1BG, were upregulated in the node. D–E Heatmap of differentially expressed proteins in the tumor (D) and lymph node (E) between the 4 treatment groups. Heatmap coloring based on normalized z-scores

