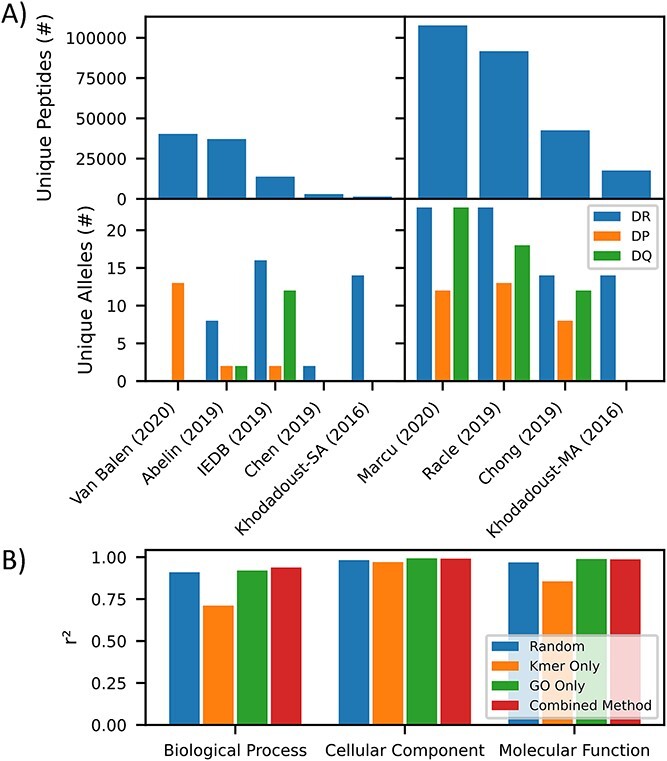
Figure 3.

pMHCII dataset. (A) Barchart depicting the number of unique peptides (upper) and unique alleles (lower) for monoallelic (left) and multiallelic sources (right) [32, 48–54]. (B) Barchart depicting goodness of split of genes with various biological processes, cellular components and molecular function between our train and test datasets, as measured by r2 for various test–train splitting methods (random, kmer, GO and our combined method).
