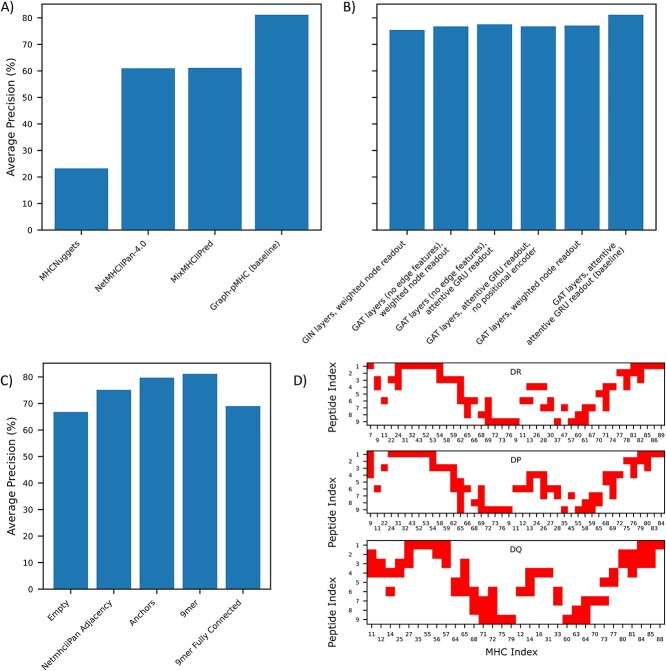
Figure 4.
pMHCII presentation performance on our test set (# positives: 57,519). (A) Comparison of Graph-pMHC test set performance with other models found in the literature. All models are only evaluated on subsets of our test dataset for which inference can be performed. P-values are 9.9 × 10−130, 3.9 × 10−178, 2.3 × 10−189, for MixMHCIIPred-1.2, NetMHCIIPan-4.0 and MHCNuggets, respectively, calculated over 100 bootstraps. (B) Impact of alternative model choices on test set performance. (C) Barchart of test set performance with the various contact maps used to observe the impact of inductive bias on test set performance. (D) Diagram of the various contact maps used.

