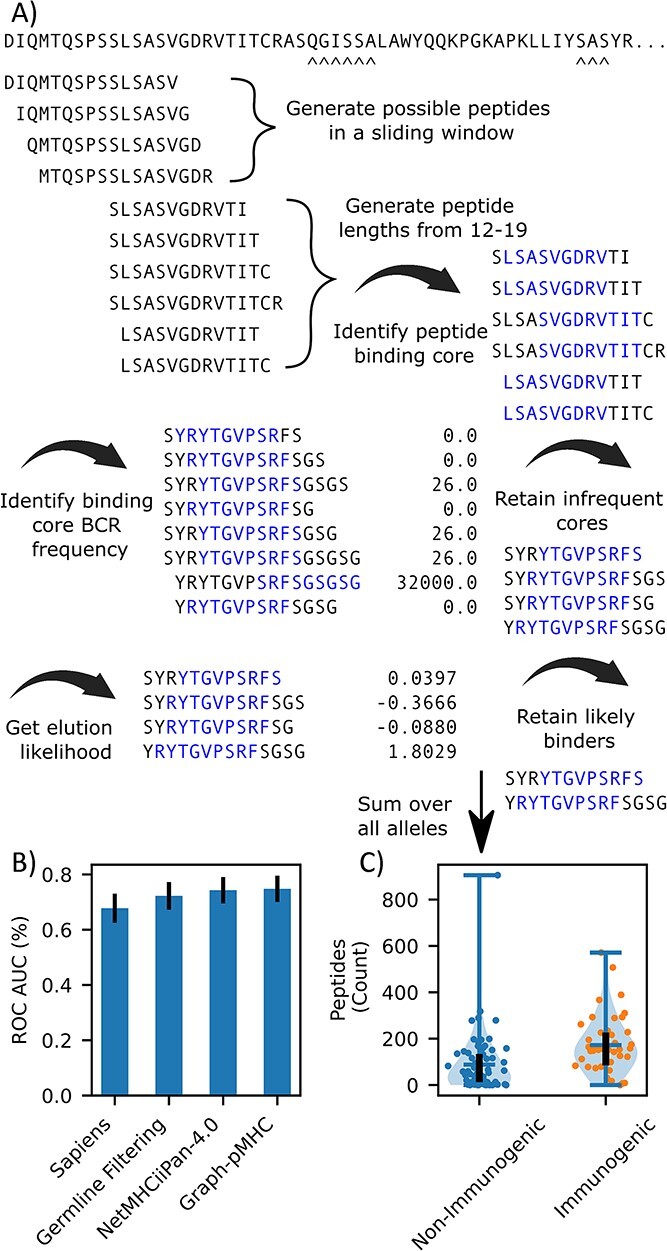
Figure 6.

Application of pMHCII to AB ADA risk assessment. (A) Schematic depicting how ADA risk of an AB is calculated. All derivable peptides are obtained, and then various filters are applied to eliminate human-like peptides, and then the number of presentable peptides is counted. (B) Barchart of the bootstrapped (500) ROC-AUC for germline filtering alone, germline filtering and NetMHCIIpan-4.0 and Graph-pMHC. (C) Violin plot of AB ADA risk for the ABs in the dataset predicted by Graph-pMHC. The bar on the left represents the median value, the black line runs from the first to third quartile, both of the dots represent the number of peptides identified for non-immunogenic, and immunogenic AB, respectively.
