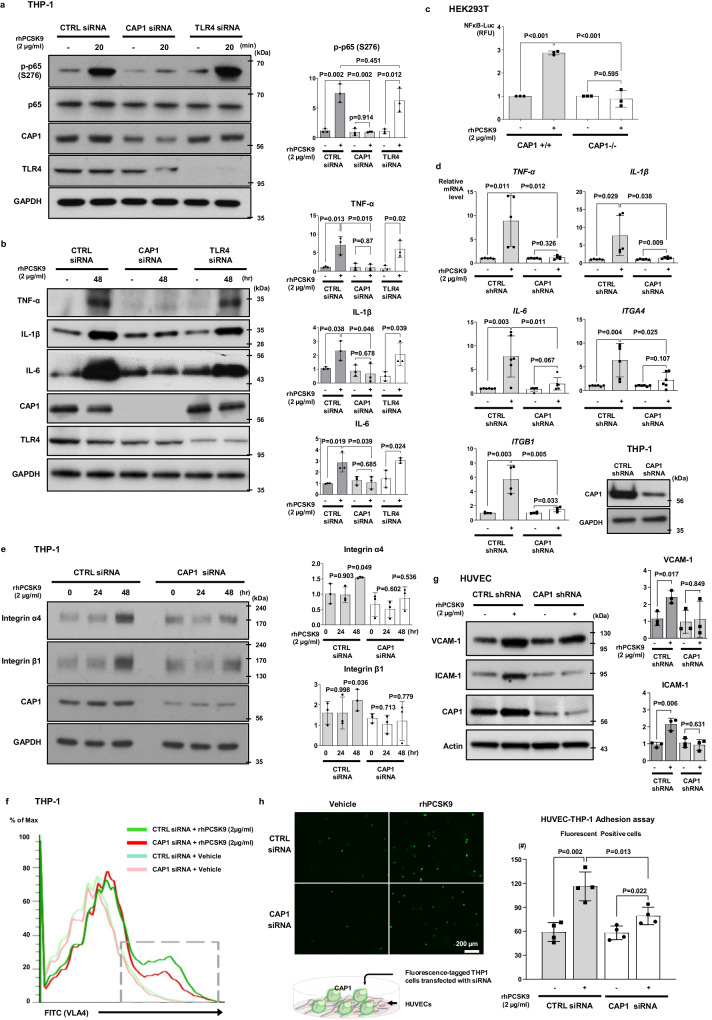
Fig. 4. CAP1 was required for PCSK9-mediated inflammation.
a Immunoblot demonstrating rhPCSK9 treatment (2 µg/mL for 20 min) resulted in NF-κB p65 phosphorylation, which was blocked in CAP1-deficient THP-1 cells, but not in TLR4-deficient THP-1 cells (N = 3). b rhPCSK9 treatment (2 µg/mL, 48 h) elevated TNF-α, IL-1β, and IL-6 protein levels in THP-1 cells treated with CTRL and TLR4 siRNA, but not in CAP1 siRNA (N = 3). c Luciferase assay demonstrating the activity of NF-κB gene promoter in CAP1+/+ and CAP1−/− 293 T cells. The activation of NF-κB signaling induced by rhPCSK9 treatment (2 µg/mL) was attenuated in CAP1−/− 293 T cells (N = 3). d qPCR demonstrating rhPCSK9-induced pro-inflammatory cytokines in THP-1 cells transfected with CTRL or CAP1 shRNA. PCSK9 treatment increased TNF-α (N = 5), IL-1β (N = 5), IL-6 (N = 6), integrin-α4 (N = 6), and -β1 (N = 4) in CTRL group, not in CAP1-deficient cells. e Immunoblot to analyze the protein levels of rhPCSK9-induced adhesion molecules in THP-1 cells. PCSK9 treatment induced the integrin-α4 and -β1 expression in a time-dependent manner (0, 24, and 48 h) in THP-1 cells with CTRL siRNA, but not in with CAP1 siRNA (N = 3). f Fluorescence-activated cell sorting demonstrating VLA-4 activation in THP-1 cells with CTRL or CAP1 siRNA. THP-1 cells were transfected with CTRL or CAP1 siRNA and left untreated or treated with rhPCSK9 (2 µg/mL). PCSK9 treatment increased VLA-4 expression in THP-1 cells, which was reduced in CAP1-deficient THP-1 cells. g VCAM-1 and ICAM-1 expression increased after rhPCSK9 treatment in HUVECs transfected with CTRL shRNA, but not in with CAP1 shRNA (N = 3). h Cell adhesion assay of THP-1 and HUVECs with rhPCSK9 treatment demonstrating that adhesion to HUVECs was enhanced by PCSK9 in THP-1 cells with CTRL siRNA, which was blocked in CAP1-deficient THP-1 cells. Representative images of fluorescently labeled adherent THP-1 cells (upper-left panel), and fluorescence-positive cells were counted to quantify cell adhesion (upper-right panel) (N = 4). The schematic figure for adhesion assay (bottom panel). The scale bar represents 200 μm. The differences between the groups were compared using the unpaired t-test (two-tailed) or one-way analysis of variance. All experiments are independently performed, and data are presented as mean values ± SD.

