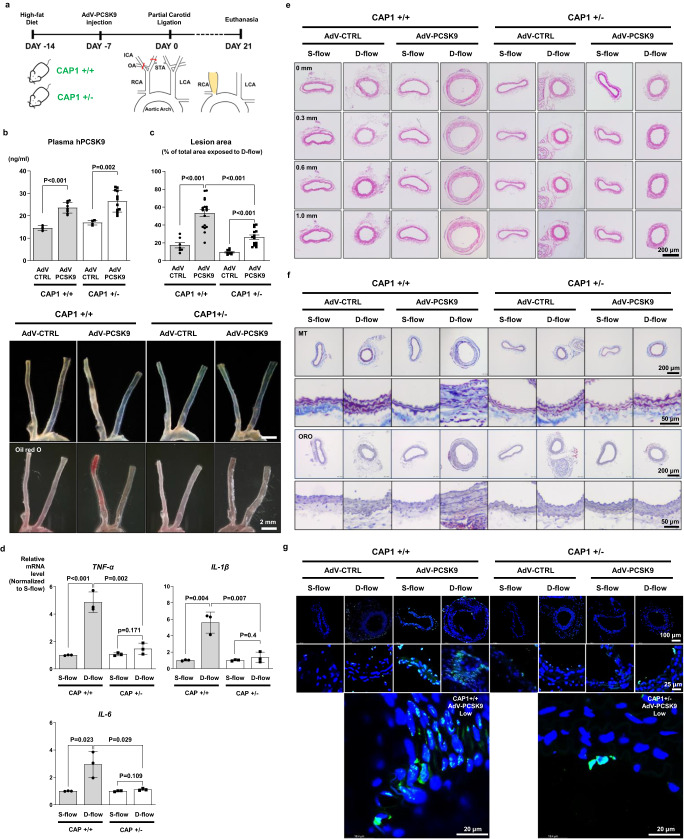
Fig. 8. CAP1 deficiency attenuated PCSK9-induced atherosclerosis in CAP1-heterozygous knockout mice.
a Experimental scheme demonstrating that PCSK9 aggravated atherosclerosis in Cap1+/+ versus Cap1+/− mice. AdV-PCSK9 (1 × 10¹¹ infectious units/mouse) was intravenously administered to mice on a high-fat diet. b Plasma hPCSK9 levels were measured using ELISA in Cap1+/+ (AdV-CTRL N = 4; AdV-PCSK9 N = 9) and Cap1+/− (AdV-CTRL N = 4; AdV-PCSK9 N = 12) mice with or without PCSK9 overexpression. The plasma hPCSK9 concentration in the AdV-CTRL group was 12–14 ng/mL, whereas it was 30–50% higher in the AdV-PCSK9 group. c Oil Red O staining of carotid arteries after AdV-CTRL or AdV-PCSK9 injection into Cap1+/+ (AdV-CTRL N = 7; AdV-PCSK9 N = 18) and Cap1+/− (AdV-CTRL N = 8; AdV-PCSK9 N = 14) mice. The atherosclerotic plaque area in the D-flow arteries increased after PCSK9 administration in Cap1+/+ mice, which was prevented in Cap1+/− mice. The scale bar represents 2 mm. d qPCR analysis demonstrating pro-inflammatory molecules in S-flow or D-flow arteries from Cap1+/+ versus Cap1+/− mice. Expression of TNF-α, IL-1β, and IL-6 was higher in D-flow than in S-flow arteries (P < 0.001, P = 0.004, and P = 0.023, respectively) in Cap1+/+ mice with a high serum level of PCSK9. However, induction of inflammatory cytokines under D-flow was prevented in Cap1+/− mice (P = 0.002, 0.007, 0.029, respectively) (N = 3). e H&E staining of S-flow or D-flow arteries (from the aortic root at 0.3, 0.6, and 1 mm, respectively) from Cap1+/+ versus Cap1+/− mice with AdV-CTRL or AdV-PCSK9. In the presence of a high serum level of PCSK9, significant atherosclerotic plaques developed under D-flow in Cap1+/+ mice, which was prevented in Cap1+/− mice. The scale bar represents 200 μm. f Masson’s trichrome and Oil red O staining. Each scale bar represents 200 μm, and 50 μm (magnified fields). g Immunofluorescence images stained with TUNEL (green). The bottom panel displays a magnified view, specifically highlighting the arteries exposed to low shear stress from the AdV-PCSK9 group. The scale bar represents 100 μm (top), 25 μm (mid) and 20 μm (enlarged). The differences between the groups were compared using the unpaired t-test (two-tailed). All experiments are independently performed. Data are presented as mean values ± SEM and SD (in (b, d) only).

