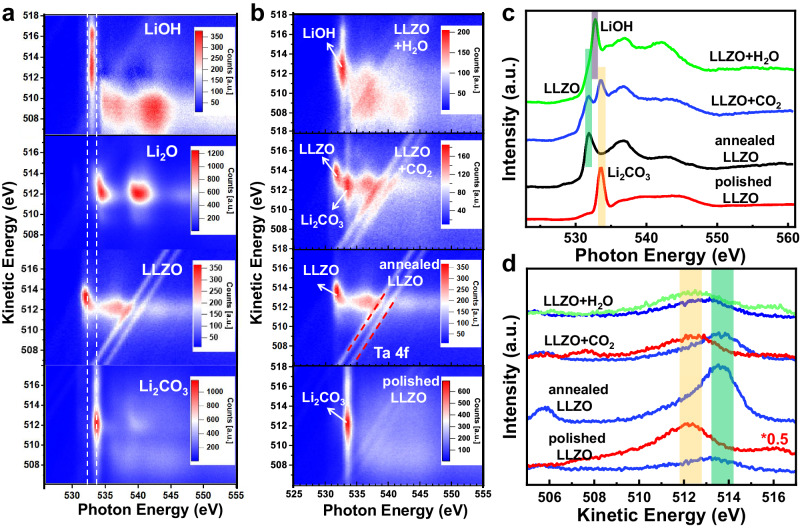
Fig. 4. The mRAS and XAS spectra of pure LiOH, Li2O, Li2CO3 and LLZO surface at different states.
a The color-coded mRAS spectra comparison of clean LLZO with pure LiOH, Li2O, Li2CO3. b The color-coded mRAS spectra comparison of LLZO surface at different states, corresponding to the process a, e, f, h in flowchart Fig. 2. The pressure of CO2 and H2O are 1 mbar and 0.5 mbar separately. c Distribution of LLZO surface at different states in photon energy direction. d Distribution of LLZO surface at different states in kinetic energy direction. LLZO (blue line) is extracted from h = 531.9 eV, Li2CO3 (red line) is extracted from h = 533.7 eV and LiOH (green line) is extracted from h = 532.8 eV.

