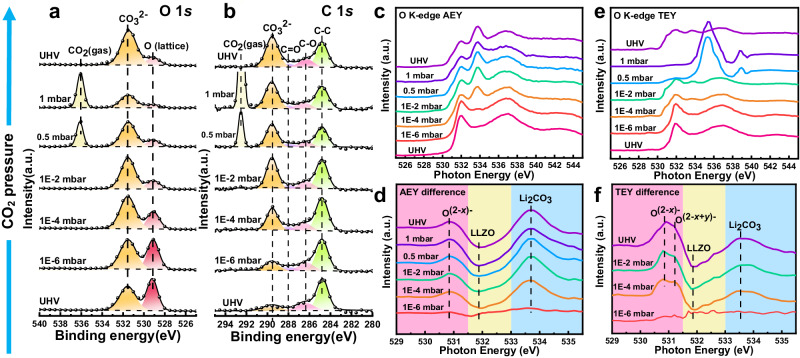
Fig. 5. The evolution of clean LLZO surface with the introduction of CO2 studied by APXPS and APXAS.
a The variation of O 1 s and b C 1 s APXPS spectra at increasing CO2 pressure from UHV to 1 mbar. c,d AEY spectra and difference images at different CO2 pressures. A new feature at 530.8 eV appears, which can be assigned to the high valence oxygen labeled as O(2-x)-. e,f TEY spectra and difference images at different CO2 pressures. Except the O(2-x)-, a new peak at 531.2 eV is observed above 1 × 10⁻⁴ mbar, attributed to the O(2-x+y)-.

