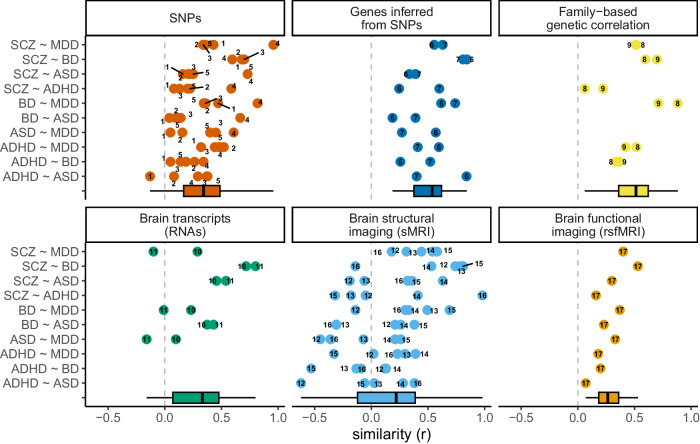
Fig. 2. Degree of similarity between disorders, measured at different levels of observation.
Each point represents the estimate of similarity (coefficient of correlation, r) between two disorders, which was measured in different studies and at different levels of observation. Descriptive statistics across studies for each level of observation are represented as boxplots; the box indicates the median, 25th, and 75th percentiles. The numbers linked to the points refer to the different studies: 1. Lee et al. [54], 2. Anttila et al. [2], 3. Lee et al. [55], 4. Schork et al. [33], 5. Grotzinger et al. [56], 6. Gerring et al. [58], 7. Li et al. [57], 8. Selzam et al. [34], 9. Wang et al. [20], 10. Gandal et al. [6], 11. Sadeghi et al. [59], 12. Kaufmann et al. [60], 13. Opel et al. [7], 14. Patel et al. [8], 15. Radonjic et al. [22], 16. Patel et al. [61], 17. Moreau et al. [5]. One study (Sey et al. [19]) that presented metrics of similarity on a scale not comparable to that of correlation coefficients was excluded from this figure.

