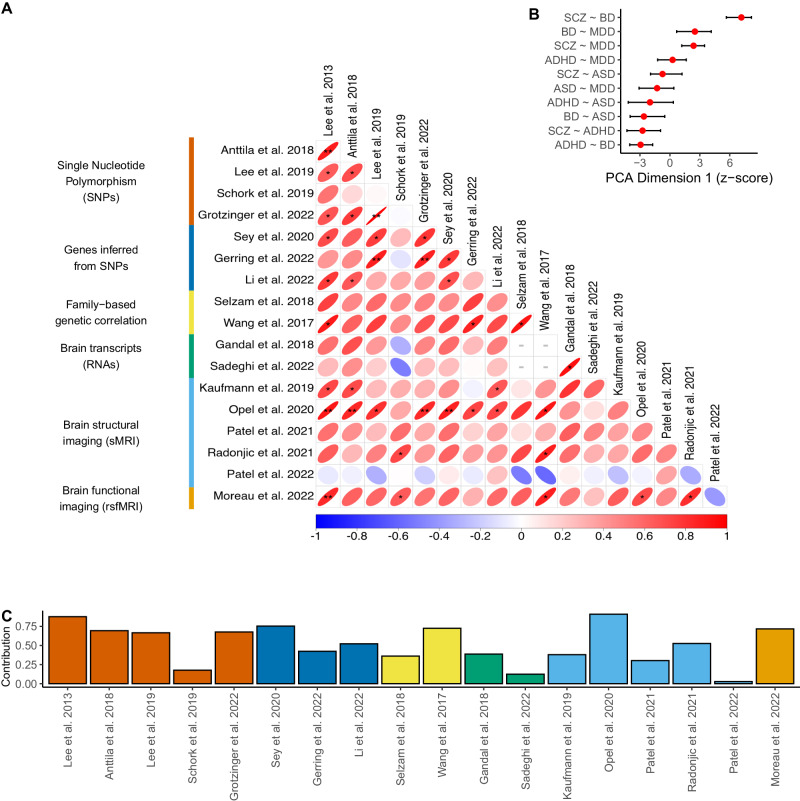
Fig. 3. Comparisons and consensus ranking of the pattern of disorder similarities across studies.
A Pairwise comparison matrix between 18 studies (Table 1) reporting on six levels of biological observation. For each pair of studies, we use the Pearson correlation coefficient to compare the pattern of similarities across disorder pairs. Significant correlations are marked as *unadjusted p < 0.05, **FDR < 0.05. Correlations with less than five pairwise disorder comparisons are marked with a gray dashed line. B The correlation matrix in panel A is summarized at the level of disorder pairs using principal component analysis (PCA), with a first dimension that accounts for 51.4% (95% CI: 43.2, 65.4) of variance among the 18 studies. Error bars represent 95% confidence intervals. A higher score on Dimension 1 implies that a pair of disorders has consistently higher similarity across all studies and levels of observation. C Contributions of individual studies to the first dimension of PCA, color-coded by the level of observation.

