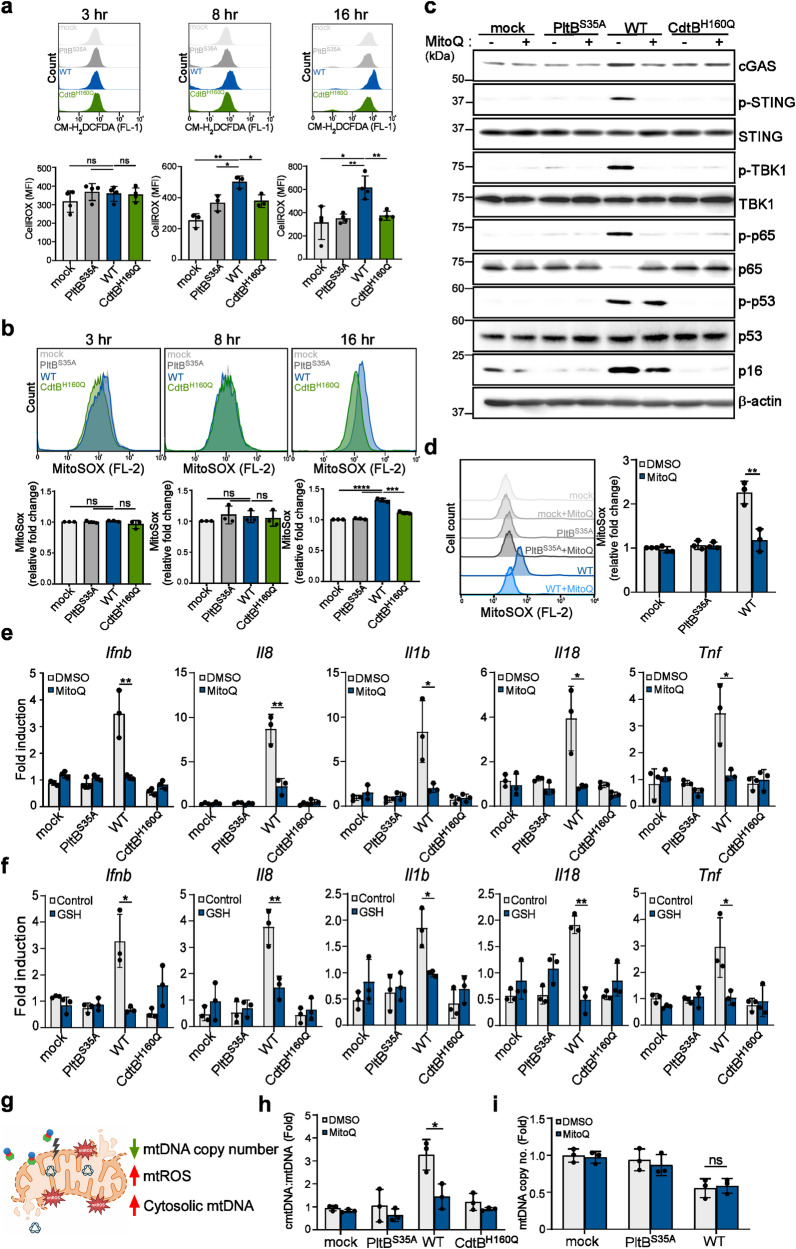
Fig. 5. Typhoid toxin-induced mitochondrial injury leads to the production of mitochondrial ROS to trigger the cytosolic release of mtDNA.
a Measurement of cellular ROS levels was performed in THP-1-derived macrophages exposed to WT typhoid toxin and different mutants. Mean fluorescence intensity (MFI) is presented as the mean ± s.d (n = 3). Statistical analysis was performed using unpaired two-sided t-tests; *P < 0.05, **P < 0.01, ns, not significant (P > 0.05). b Measurement of mitochondrial ROS was conducted in THP-1-derived macrophages exposed to typhoid toxin. Mean fluorescence intensity (MFI) is presented as the mean ± s.d (n = 3). Statistical analysis was performed using unpaired two-sided t-tests; ***P < 0.001, ****P < 0.0001, ns, not significant (P > 0.05). c THP-1-derived macrophages exposed to typhoid toxin and its mutants were incubated with MitoQ (2 μM) for 16 h. Cell lysates were analyzed using western blot with antibodies against cGAS, phosphorylated STING, phosphorylated TBK1, phosphorylated p65, phosphorylated p53, p16INK4a, and β-actin as a loading control. d Mitochondrial ROS levels were assessed in THP-1-derived macrophages treated with typhoid toxin at 16 h post-treatment. Mean fluorescence intensity is presented as the mean ± s.d (n = 3). Statistical analysis was performed using unpaired two-sided t-tests; **P < 0.01. e, f RT-qPCR analysis was conducted to measure the mRNA levels of the indicated genes in THP-1-derived macrophages exposed to WT typhoid toxin and different toxin mutants, with or without MitoQ (2 μM) (e) or GSH (10 mM) (f) treatment. Data are presented as the mean ± s.d (n = 3). Statistical analysis was performed using unpaired two-sided t-tests; *P < 0.05, **P < 0.01. g The schematic model of mitochondrial damage induced by typhoid toxin (Created with BioRender.com). h RT-qPCR of cytosolic mtDNA (cmtDNA) quantified relative to total mtDNA in THP-1-derived macrophages exposed to typhoid toxin with MitoQ treatment. Data are presented as the mean ± s.d (n = 3). Statistical analysis was performed using unpaired two-sided t-tests; *P < 0.05. i RT-qPCR of mtDNA copy number in THP-1-derived macrophages exposed to WT typhoid toxin and the PltBS35A mutant with or without MitoQ treatment. Data are presented as the mean ± s.d (n = 3). Statistical analysis was performed using unpaired two-sided t-tests; ns, not significant (P > 0.05). The western blots shown in (c) are representative of 3 independent experiments. Source data are provided as a Source data file.

