
Figure 3.
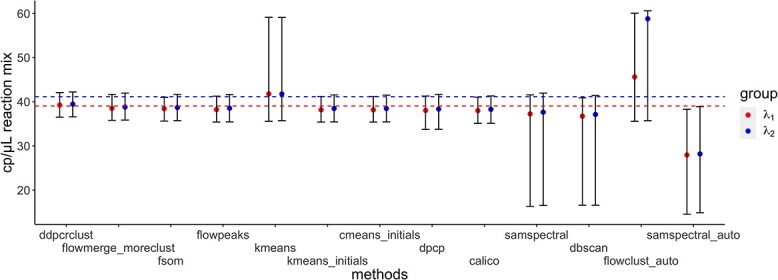
CI of  and
and  for HR dataset. The confidence interval is calculated based on the resampled 10, 000 data points with the optimal tuning parameter values. The 95% confidence interval spans from the 2.5th to the 97.5th percentile of all estimates. The red dashed line in the plot represents the true value for
  , while the blue line represents the true value of
  . The methods are ordered by the relative bias of the mean concentration to the true value.