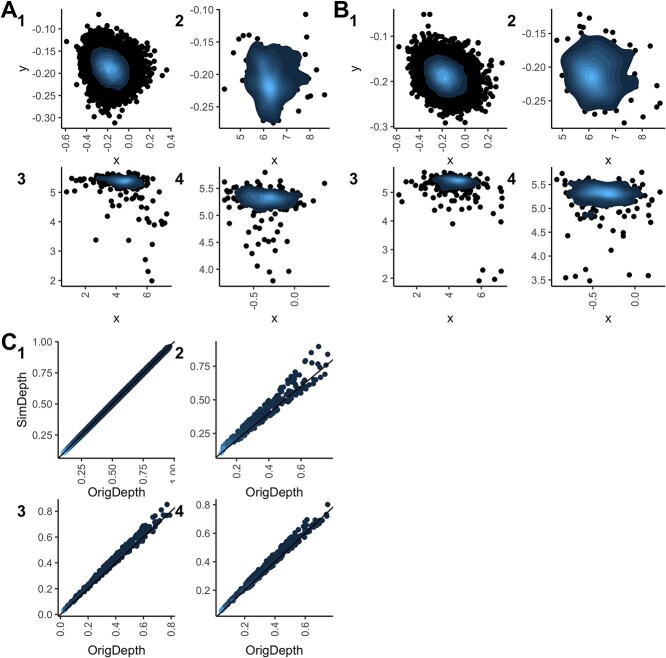
Figure 4.
Goodness-of-fit for the HR dataset. (A)–(B) Density plots of the original and simulated data, respectively, and (C) depth-depth plots. 1, 2, 3 and 4 represent the negative population, single positive 1, double positive and single positive 2, respectively. The further the data points from the cluster center, the darker those data points are. Depth values indicate how deep a data point is within the data distribution, with more central or typical points having higher depths and outliers having lower depths [35].

