

Abstract
Cardiac resynchronization therapy (CRT) is a standard treatment for patients with heart failure. However, 30–40 % of the patients having CRT do not respond to CRT with improved clinical symptom and cardiac functions. It is important for CRT response that left ventricular (LV) lead is placed away from scar and at or near the site of the latest mechanical activation. Nuclear image-guided approaches for CRT have shown significant clinical value to assess LV myocardial viability and mechanical dyssynchrony, recommend the optimal LV lead position, and navigate the LV lead to the target coronary venous site. All these techniques, once validated and implemented, should impact the current clinical practice.
Keywords: Cardiac resynchronization therapy (CRT), Heart failure (HF), Left ventricle (LV), Mechanical dyssynchrony
Introduction
Heart Failure Is a Prevalent and Costly Disease
Over 5 million Americans ≥20 years of age live with heart failure (HF), and the annual new incidence of HF is about 670, 000 [1]. Despite rapid development of HF treatment, the number of deaths attributable to HF was as high in 1995 (287,000) as it was in 2009 (275,000), and the hospital discharges were essentially unchanged from 2000 to 2010 (about 1 million per year) [1]. The total cost for HF in 2013 was estimated at $32 billion [1].
What Is CRT?
Cardiac resynchronization therapy (CRT) is a treatment performed with an implantable programmable biventricular pacemaker with (CRT-D) or without (CRT) defibrillation therapy. These devices help to coordinate the left ventricle’s pumping function and improve blood flow as well as speed up the heart that is beating too slowly. Metal leads connected to CRT detect heart rate irregularities and emit electrical stimulation to correct them. Depending on the therapy, both ventricles, or sometimes, only the left ventricle, are paced. The average cost is >$60,000/patient for CRT alone, and the number of CRT procedures is >60,000 per year in the United States alone [2].
Why and When to Use CRT?
CRT has been shown to benefit a cohort of HF patients in large randomized trials [3–10] and is now a standard treatment for systolic HF [11]. CRT is used to help resynchronize the heart, reduce symptoms of heart failure, and improve the quality of life for HF patients by increasing exercise capacity and allowing them to resume many daily activities.
CRT Patient Selection
The standard indications for CRT are for patients who have left ventricular ejection fraction (LVEF) ≤35 % and sinus rhythm, left bundle-branch block (LBBB) with a QRS duration ≥150 ms on electrocardiogram (ECG), and New York Heart Association (NYHA) class II, III, or ambulatory IV symptoms on guideline-determined medical therapy (GDMT) [11]. According to an Agency for Healthcare Research and Quality evidence report, 15–20 % of HF patients meet the standard indications for CRT [2]. These criteria are continuously changing and are different in Europe compared to the United States.
CRT Installation
The installation of a CRT device for heart failure is a standard medical procedure. The device is placed under the skin of the chest and connected to the leads that are inserted through the veins into the heart. The procedure usually takes 1–2 h. The cardiologist guides the lead into the correct chamber of the heart and checks its position under fluoroscopy guidance. The lead is then connected to the CRT monitor on the surface of the chest. The appropriate electrical energy and pacing timing are then tested.
What Influences a Successful CRT Response?
CRT Positive Response
The benefits of CRT on heart failure patients have been extensively demonstrated in a large number of clinical trials [3–10]. The CRT positive response includes the improvement of LV functions, reverse remodeling (the reduction of LV volume and mitral regurgitation), heart failure symptoms and heart failure classes, and the increase of exercise capability and quality of life score. The long-term CRT benefits include the reduction of heart failure hospitalization and morbidity/mortality rate. Noteworthy, reverse remodeling, which is considered the primary mechanism of improved symptoms and outcome in heart failure patients, has been shown as a long-term improvement in CRT positive responders [12, 13].
CRT non-Response
Based on the standard indications, 30–40 % of the patients having CRT did not respond to CRT with improved clinical symptom (assessed by NYHA class, quality of life score, and 6-min walk distance) and/or cardiac function (assessed by LV end-systolic volume, LV end-diastolic volume, and LVEF) [6, 7, 14–16]. Thus, it is imperative for improving HF patients’ prognosis and reducing healthcare costs to enhance CRT response.
Reasons of CRT non-Response
The main reasons of CRT non-response were reviewed in [17]. (1) Selection of patients based on QRS duration is not optimal. QRS duration is not predictive to CRT response; instead, mechanical dyssynchrony is important for response to CRT [18]. It has been our experience and that of others [19, 20, 21•] that left ventricles that are not mechanically dyssynchronized will not respond and often deteriorate following CRT. (2) The presence of extensive LV scar tissue may also hamper response to CRT. Patients with extensive scar tissue (irrespective of the location) have a low likelihood of response to CRT [22, 23]. (3) Moreover, It is important for CRT response that the LV lead is placed away from scar [24] and at or near the site of the viable segment with the latest activation [25, 26]. (4) Visualization of the optimal LV lead position on fluoroscopy venograms during implantation is important. The Targeted Left Ventricular Lead Placement to Guide Cardiac Resynchronization Therapy (TARGET) trial showed that LV leads were non-optimally placed in 37 % of the patients, even if the implanters knew the optimal regions given by echocardiography before implantation, but implanted the LV leads without explicit myocardial image guidance on fluoroscopy venograms [27].
Focus of This Review
This review is focused on identifying the optimal CRT LV lead positions from nuclear images and fusing it with fluoroscopy for navigating the LV lead to the optimal positions. LV lead position is an essential factor for CRT response [7, 24, 25, 28–30, 31•, 32]. It is important for CRT response that LV lead is placed away from scar [24] and at or near the site of the latest activation [25, 26]. However, the current guidelines recommend LV lead placement in a lateral or posterolateral myocardial wall, causing that suboptimal or inappropriate LV lead placement is prevalent in a significant number of patients, for example, 37% in [25], 35% in [26], and 42% in [31•]. In addition, the optimal LV lead positions identified by the myocardial imaging techniques are represented on the myocardial wall, which is not visualized on intraoperative fluoroscopic venograms that CRT implanters used to guide LV lead placement. The implanters may not accurately correspond the optimal LV lead positions with the venous anatomy, resulting in suboptimal or inappropriate LV lead placement. In the TARGET [27] and Speckle Tracking Assisted Resynchronization Therapy for Electrode Region (STARTER) [28] trials, the implanters visually aligned the venous anatomy from the LAO fluoroscopic venograms with the short-axis echocardiographic view to perform echocardiography-guided LV lead placement. Such visual correspondence resulted in suboptimal and inappropriate LV lead placement in a significant number of patients (26 and 10 % in the TARGET trial and 55 and 15 % in the STARTER trial, respectively).
Myocardial Imaging Modalities to Guide CRT Implantation
Myocardial imaging techniques, such as echocardiography [27, 28, 33], MRI [34], and nuclear imaging [31•, 35–37], have shown their potentials to detect scar and site of the latest activation to optimize LV lead positions for improved CRT response. Several review papers about myocardial imagingguided CRT are available [17, 30, 38–41].
Echocardiography
Echocardiographic dyssynchrony indices were shown to predict CRT response [14–16, 42] and identify sites of the latest activation as optimal LV lead positions [25, 26]. Additional imaging is needed to assess both dyssynchrony and scar for optimizing LV lead placement. A major limitation of echo-guided CRT implantation is its high inter-operator variability which resulted in the main reason of its modest accuracy to predict CRT response in the Predictors of Response to CRT (PROSPECT) trial [43].
CT
CT can assess LV veins [44, 45] and detect scar with a good correlation with LGE-MRI [46]. Wall thickening assessed by CT can be used to assess LV dyssynchrony [47]. However, CT measures of LV dyssynchrony have neither been shown to predict CRT response nor to optimize LV lead placement.
Cardiac MRI
MRI has been shown to assess LV myocardial viability and mechanical dyssynchrony, and to allow visualization of veins [48]. However, the broad use of MRI to optimize CRT still faces major challenges. MRI tools are complicated and time-consuming and involve significant user interaction. These MRI techniques were studied in small cohorts with different indices, hindering their advances to multi-center trials.
ECG-Gated Myocardial Perfusion SPECT/PET Imaging to Guide CRT Implantation
Among myocardial imaging techniques, nuclear imaging has the unique advantages that it can assess myocardial perfusion, viability, mechanical dyssynchrony, and LV global function in a single scan. The role of nuclear imaging with gated singlephoton emission-computed tomography (SPECT) myocardial perfusion imaging (MPI) or positron emission tomography (PET) in CRT has been recently reviewed and described as a “one-stop shop” to predict CRT response: it assesses scar burden and location, LV function, LV site of the latest contraction, and mechanical dyssynchrony from a single scan [31•, 35, 37, 39–41, 49–51]. Compared to other approaches, nuclear imaging is very promising for widespread clinical use, because: (1) nuclear study, especially resting SPECT MPI, is routinely practiced, well standardized, and inexpensive; and (2) tools to assess myocardial viability and mechanical dyssynchrony and global function are largely automatic and highly reproducible.
Clinical Parameters Used in Nuclear Imaging to Guide CRT Implantation
It is important that the LV leads be placed in regions with the late activation [25, 26] and viable tissues [24, 52–55]. ECG-gated SPECT MPI and PET have been demonstrated to assess LV dyssynchrony and scar burden for improving CRT patient selection and to assess regional viability and activation for optimizing LV lead positions.
Nuclear Imaging to Detect Myocardial Viability
Positron Emission Tomography
18Fluorine-deoxyglucose (FDG) is commonly used to assess myocardial viability in PET studies. This FDG tracer is a glucose analog and reflects cardiac glucose utilization. FDG imaging is combined with assessment of perfusion using PET tracers (usually 13nitrogen-ammonia or 82Rb) to detect the different patterns in areas of contractile dysfunction [40]. Viable tissue demonstrates normal perfusion and FDG uptake. Scar tissue is classified by lower (non-transmural scar) or absent perfusion and absent FDG uptake (transmural scar).
Single-Photon Emission-Computed Tomography
Both 201thallium chloride and 99technetium-labeled SPECT tracers have been used to detect viability. Following intravenous injection, the initial uptake of 201thallium predominantly reflects myocardial perfusion, and the prolonged retention/uptake reflects cell membrane integrity [40]. Both stress-redistribution-reinjection and rest-redistribution protocols have been used in the clinical setting to assess myocardial viability.
Image Processing for Detection of Viable Segments
In areas of contractile dysfunction, a 50–60 % tracer uptake on a resting image is commonly used as threshold for myocardial viability. The thresholding method [56] has been widely used to quantify scar burden in phantoms [57], animals [58], and humans [59]. Perfusion defects measured by SPECT agreed closely with fibrosis quantified by pathology [60, 61].
Clinical Application in CRT Response
The presence, location, and burden of myocardial scar, assessed from nuclear images, have been demonstrated to affect response to CRT [39, 40, 62, 63]. Adelstein et al. found that there was an inverse relationship between the extent of fixed perfusion defect on MPI and absolute or relative increase in LVEF 6-month post-CRT in a clinical study. Furthermore, patients who responded to CRT had lower global scar burden near the LV lead versus non-responders [23, 31•]. Also, scar burden near the LV lead correlates negatively with improvement in LVEF [23] and is associated with no response in 29 % of patients with extensive scar at LV lead site despite having the lead with site of the latest activation [31•]. Bose et al. found that in 160 CRT patients with ischemic cardiomyopathy, scar and reversible ischemia in or adjacent to LV lead positions were independent predictors of HF hospitalization and death [63]. It was also shown that a transmural scar (<50% tracer uptake) at the site of LV lead placement was associated with CRT nonresponse [64]. An advantage of nuclear imaging is the ability to automatically quantify the scar burden with good reproducibility [65]. A reproducibility of 96 % was reported in the quantitative analysis of perfusion defect from serial exercise 201thallium SPECT MPI [66].
Nuclear Imaging to Detect Mechanical Dyssynchrony
LV dyssynchrony is an essential parameter for CRT response [67]. The phase analysis tool is the most widely used method to assess LV mechanical dyssynchrony from nuclear images. It was first investigated by Chen et al. to measure LV dyssynchrony from gated SPECT MPI [68].
Phase Analysis Technique
The technique of phase analysis to assess mechanical dyssynchrony has been extensively described by Chen et al. using the Emory Cardiac Toolbox (SyncTool, Emory University, Atlanta, GA) [39, 68] (Fig. 1). Briefly, a three-dimensional sample distribution with maximum counts along LV myocardial wall is extracted from each of the gated LV short axis data sets; a one-dimensional first-harmonic Fourier approximation is applied to the count variation over time for each myocardial segment, generating a 3D phase distribution that describes the timing of LVonset of mechanical contraction over the entire R-R cycle. Two clinically relevant dyssynchrony indices are derived: phase standard deviation (PSD) and phase bandwidth (PBW) [68]. The normal values have been published and validated [68–70].
Fig. 1.
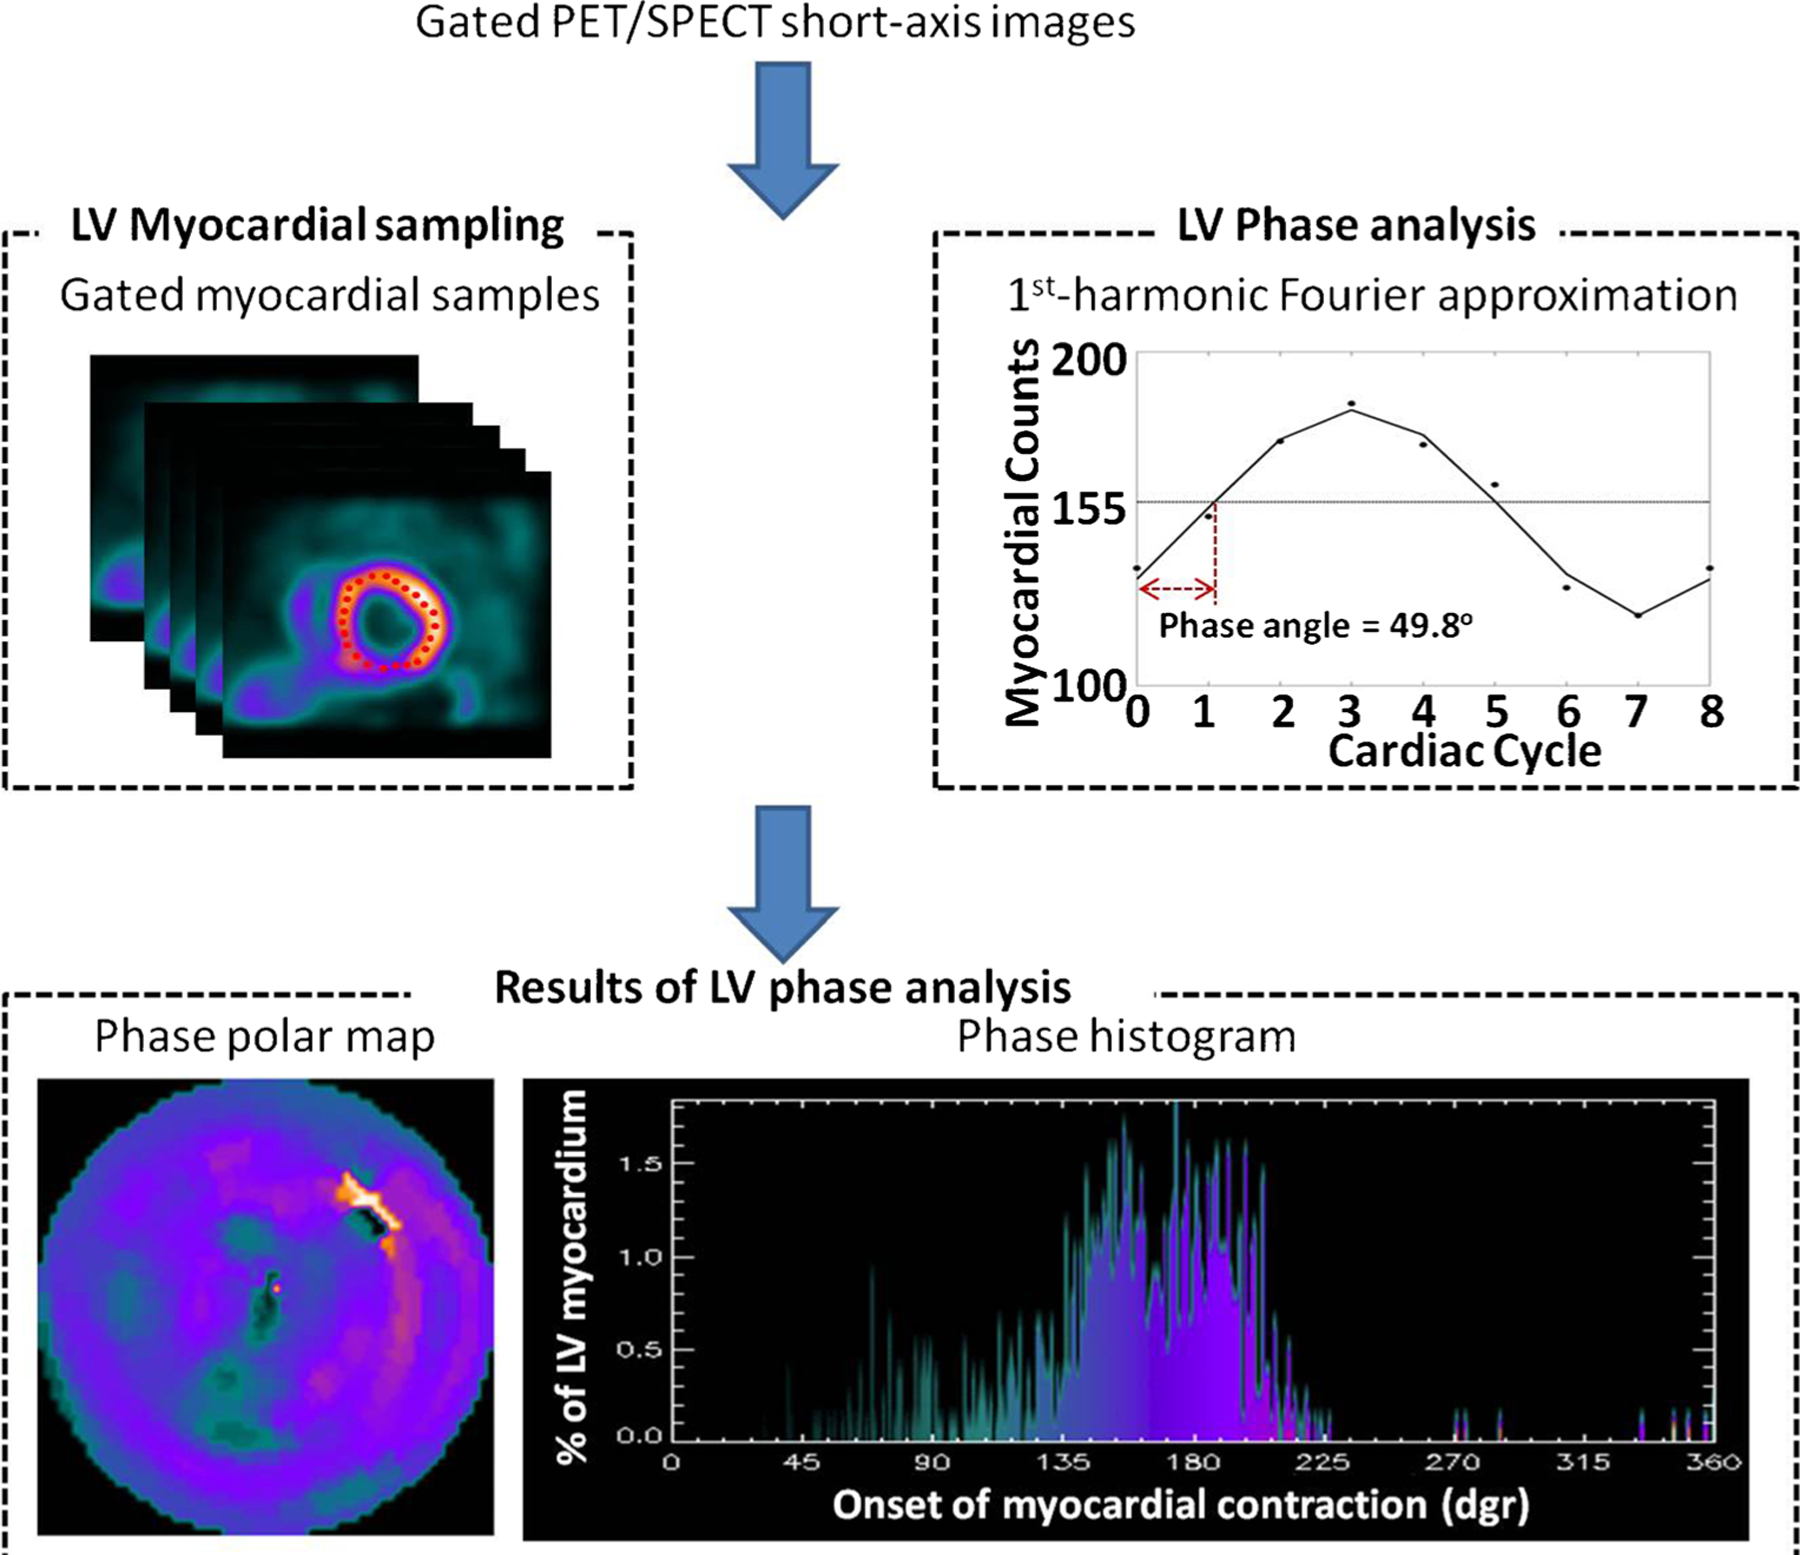
Phase analysis output in a patient with LBBB and dyssynchrony. Gated PET/SPECT LV short-axis images are acquired from gated PET/SPECT scans with image reconstruction and reorientation. An automatic maximum count myocardial sampling algorithm is applied to the short-axis images, searching the regional maximum count to detect the regional wall thickening. Phase analysis uses one-dimensional first-harmonic Fourier approximation to analyze the count variation over time for each sample, generating a phase distribution that describes the timing of LV onset of mechanical contraction over the entire R-R cycle. The results of phase analysis, i.e., the phase angles of regional myocardial wall, are represented on the phase polar map and phase histogram [68]. The phase histogram depicts the distribution of the percent of LV segments (y-axis) that start to contract at the same time (x-axis), where time is measured in degrees (360° = 1 R-R cycle). Thus, the narrower the distribution, the more synchronous the LV contraction. The LV phase polar map localizes the LV segments contraction by color coding the time of onset as the same color seen in the histogram where the lighter colors in the mid anterolateral region are associated with the segments that contract last. An animated display of the wave of onset of mechanical contraction is shown in Video 1. In this display, as a cursor moves across the phase histogram, those myocardial segments that coincide to the location of the cursor are blackened superimposed on the LV perfusion polar map
The technique is fully automated, has effective temporal resolution of ∼15 ms for a heart rate of 60/min [71], inter- and intraobserver reproducibility of 99 % [72], high repeatability [73], good robustness with camera types [74], tracer dose [75], heart rate [76], and perfusion defects [77]. The LV dyssynchrony parameters have been shown to correlate well with those by tissue Doppler imaging [78, 79].
Clinical Application in CRT Response
It has been demonstrated mechanical dyssynchrony is associated with the extent of cardiomyopathy (P = 0.01), scar burden (P < 0.0001), and QRS duration (P = 0.04) [80]; however, the correlation between mechanical dyssynchrony and each of these parameters is far from perfect (r = −0.49; 0.50–0.65; 0.25–0.50, respectively) [70], suggesting that mechanical dyssynchrony may provide incremental value [40]. In a retrospective clinical study with 42 heart failure patients having CRT, a cut-off value for PSD of 43° was shown to have 74 % sensitivity and 81 % specificity to predict clinical response to CRT and LV reverse remodeling [81]. Figure 2 illustrates phase analysis results on a patient undergoing successful CRT response.
Fig. 2.
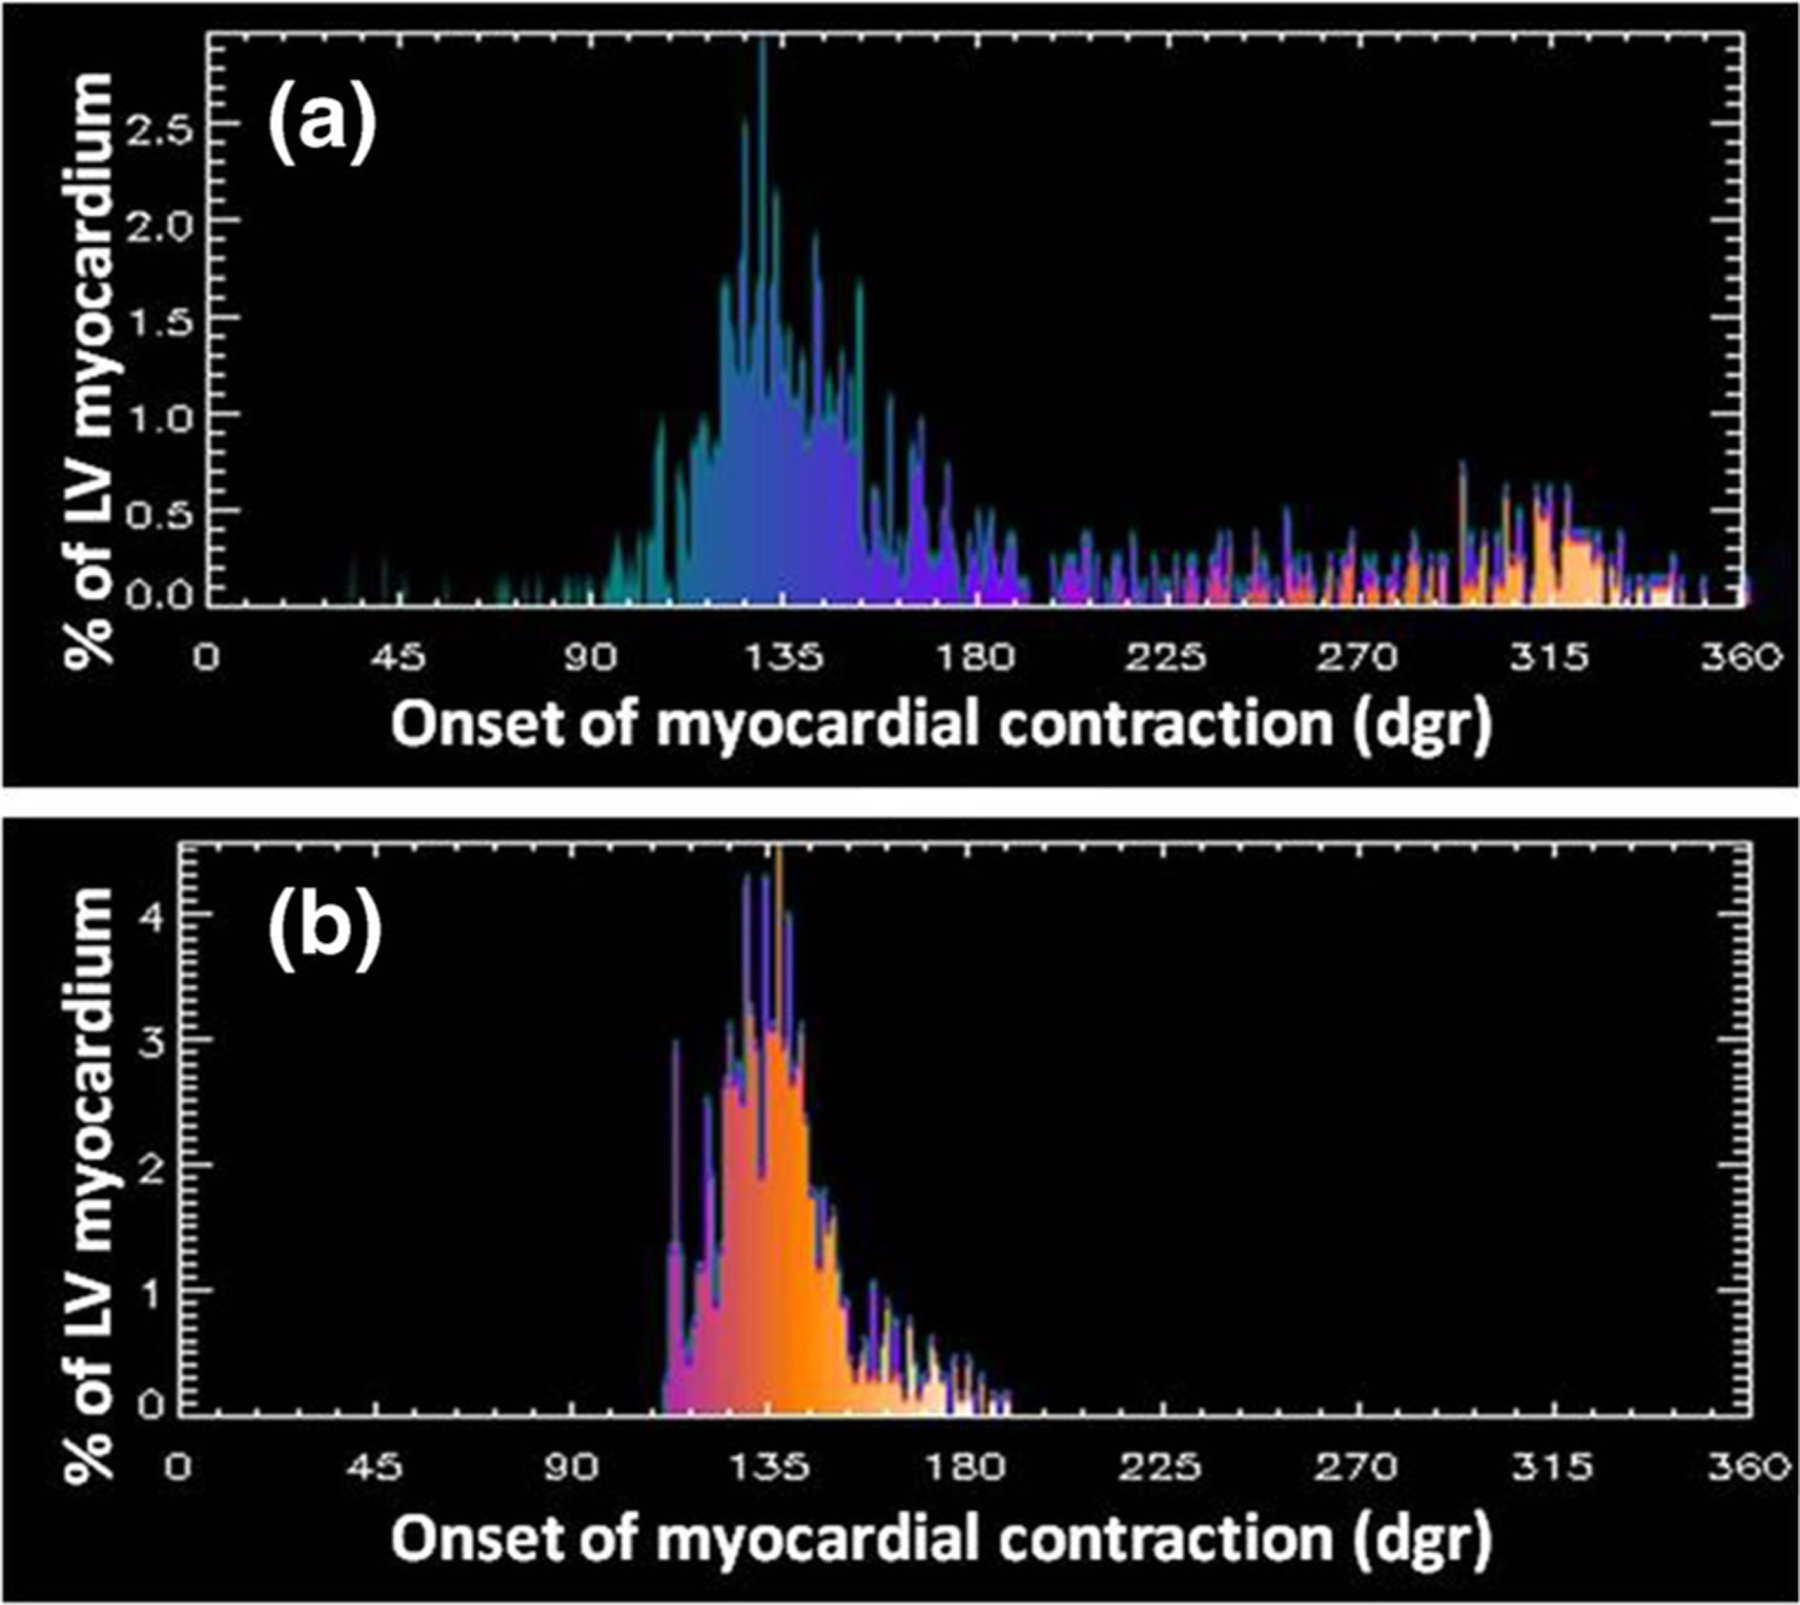
Phase histograms before and after successful CRT. a Pre-CRT phase histogram. b Post-CRT phase histogram. Note how the phase histogram has become significantly narrower (more synchronous) post-CRT as compared to pre-CRT indicating a successful response. (Patient study courtesy of Ami Iskandrian M.D., UAB, AL)
Furthermore, it has been shown that the change of dyssynchrony parameters occurs immediately after CRT implantation and may predict long-term LV reverse remodeling [42]. It would therefore be possible, using gated SPECT with single tracer injection, to adjust CRT parameters to optimize response immediately after implantation [42, 73].
Nuclear Imaging to Identify the Optimal LV Lead Position
Integral tools have been developed to fuse myocardial activation and viability to identify the optimal LV lead positions. The regional phase analysis tool was shown to assess regional activation and identify sites of the latest activation as optimal LV lead positions in a 6-segment model [31•]. It has been integrated with the regional viability quantification tool into lead-concordance criteria (i.e., segments with >50 % regional viability and in or adjacent to the site of latest mechanical activation are concordant positions) [37]. This finding was consistent with that in a study using echocardiography [42].
Clinical Trials Using Nuclear Imaging to Predict or Improve CRT Response
Several retrospective clinical studies have used SPECT (31,37) and PET (35,36) to guide CRT LV lead placement (Table 1). A prospective international clinical trial using SPECT to guide CRT is ongoing [82].
Table 1.
Summary of the main nuclear image-guided CRT clinical studies
PET to Predict CRT Response
In a PET study, Uebleis et al. [35] aimed to distinguish responders to CRT from non-responders, using gated FDG PET. They found that compared with non-responders, CRT responders showed significant differences in the declines of LV end-systolic volume and brain natriuretic peptide and in left ventricular dyssynchrony, extent of the myocardial scar burden, and biventricular pacemaker leads positioned within viable myocardial regions. In the other PET study, Lehner et al. [36] made the similar assumption that the probability of a CRT response increases with the presence of high amounts of “viable and dyssynchronous” myocardium. Nineteen patients underwent ECG-gated FDG PET before CRT implantation and were followed for 6 months. Response to CRT was defined as clinical improvement of at least one NYHA class in combination with LVEF improvement of >5 %. Twelve responders (71 %) and seven non-responders (29 %) were identified. For each patient, polar maps of FDG uptake and phase analysis were calculated and fused. Amounts of myocardium representing “viable and synchronous,” “scar and synchronous,” viable and dyssynchronous, or “scar and dyssynchronous” myocardium were quantified by measuring the fused polar maps. Responders by definition showed significant decrease in NYHA class and significant increase of LVEF. Furthermore, a significantly higher amount of viable and dyssynchronous myocardium was found before CRT in responders as compared to non-responders.
SPECT to Predict CRT Response
In a clinical study guided by gated SPECT MPI, Friehling et al. [37] used SPECT MPI to identify the optimal LV lead positions. In that study, a concordant LV lead position was defined as the LV lead placed in the segment with myocardial viability and with or adjacent to the latest mechanical activation. It was showed that 96 % of the patients, who had baseline mechanical dyssynchrony, acceptable scar burden (<40 %), and a concordant LV lead position, had favorable acute CRT response and long-term outcome. Boogers et al. [31•] conducted a similar study. In this study, 90 patients with advanced heart failure were enrolled. They showed that concordance of the latest LV activation by phase analysis with lead placement during CRT implantation was associated with improvement in LV reverse remodeling. The site of the latest activation was determined using a 6-segment model [31•]; the mean phase of every segment was calculated, and the highest value corresponded to the latest activated segment. In 52 patients (58 %), the LV lead was placed at the site of the latest mechanical activation (concordant), and in 38 patients (42 %), the LV lead was placed outside the site of the latest mechanical activation (discordant). Favorable CRT response was significantly more often documented in patients with a concordant LV lead position than in patients with a discordant LV lead position (79 vs. 26 %). After 6 months, patients with a concordant LV lead position showed significant improvement in LV functions, whereas patients with a discordant LV lead position showed no significant improvement in LV functions.
Image Fusion Technique to Help Select the Target Venous Site
The mainstream CRT implantation uses fluoroscopy venograms to guide lead placement [29]. The optimal LV lead positions are identified on LV myocardial wall in the current myocardial imaging studies, which are not visualized on X-ray fluoroscopy venograms during implantation. In addition, they may not contain any suitable venous branch for the LV lead placement. Furthermore, implanters may not accurately correspond venous anatomy with the myocardial wall segmentation. Such inaccurate correspondence may result in suboptimal or inappropriate LV lead placement, as a change of LV lead position by ∼20 mm could impact on CRT response [83]. Therefore, visualization of LV myocardial wall and recommended LV lead positions by the myocardial imaging techniques during implantation is important for image-guided LV lead placement.
A potentially more direct method to guide lead placement is to employ CT venography to assess the venous anatomy. This method is being validated in an ongoing clinical trial [84]. It requires extra anatomical imaging and causes additional radiation exposure.
A 3D fusion method to integrate LV venous anatomy on fluoroscopy venograms with LV epicardial surface on SPECT MPI for image-guided LV lead placement has also been developed [85•]. In this method, 3D LV venous anatomy was reconstructed from the fluoroscopic venograms, and LV epicardial surface was extracted from the SPECT images and then fused with the venous anatomy. The venous anatomy extracted from CT venography was used as the reference standard to evaluate the technical accuracy of 3D fusion. In the retrospective clinical study with ten CRT patients, the distance between the fluoroscopic and CT veins on the SPECT epicardial surfaces was 4.6 ± 3.6 mm (range: 0–16.9 mm), which is small as compared to the segmental size of AHA 17-segment model (∼30 × 30 mm2). Furthermore, the presence of the fluoroscopic and CT veins in the segments agreed well, with a Kappa value of 0.87. The clinical applicability of the 3D fusion toolkit was confirmed by a prospective clinical study of using it to guide LV lead placement during CRT in the cath lab. Details of this prospective study will be given in the following patient example. The preliminary results of retrospective and prospective clinical studies have suggested that the 3D fusion method is both technically accurate and clinically applicable.
SPECT-Guided CRT LV Lead Placement: a Prospective Patient Example
The integrated toolkit to guide CRT LV lead placement, including recommending the optimal LV lead position and navigating the LV lead to the target LV venous site, was tested in a cath lab [85•]. One patient was enrolled, and this patient (68 years old, male) had dilated cardiomyopathy with NYHA class II, low LVEF (32 %), and wide QRS duration (168 ms). Figure 3 shows the SPECT-guided CRT LV lead placement and related follow-ups for this patient.
Fig. 3.
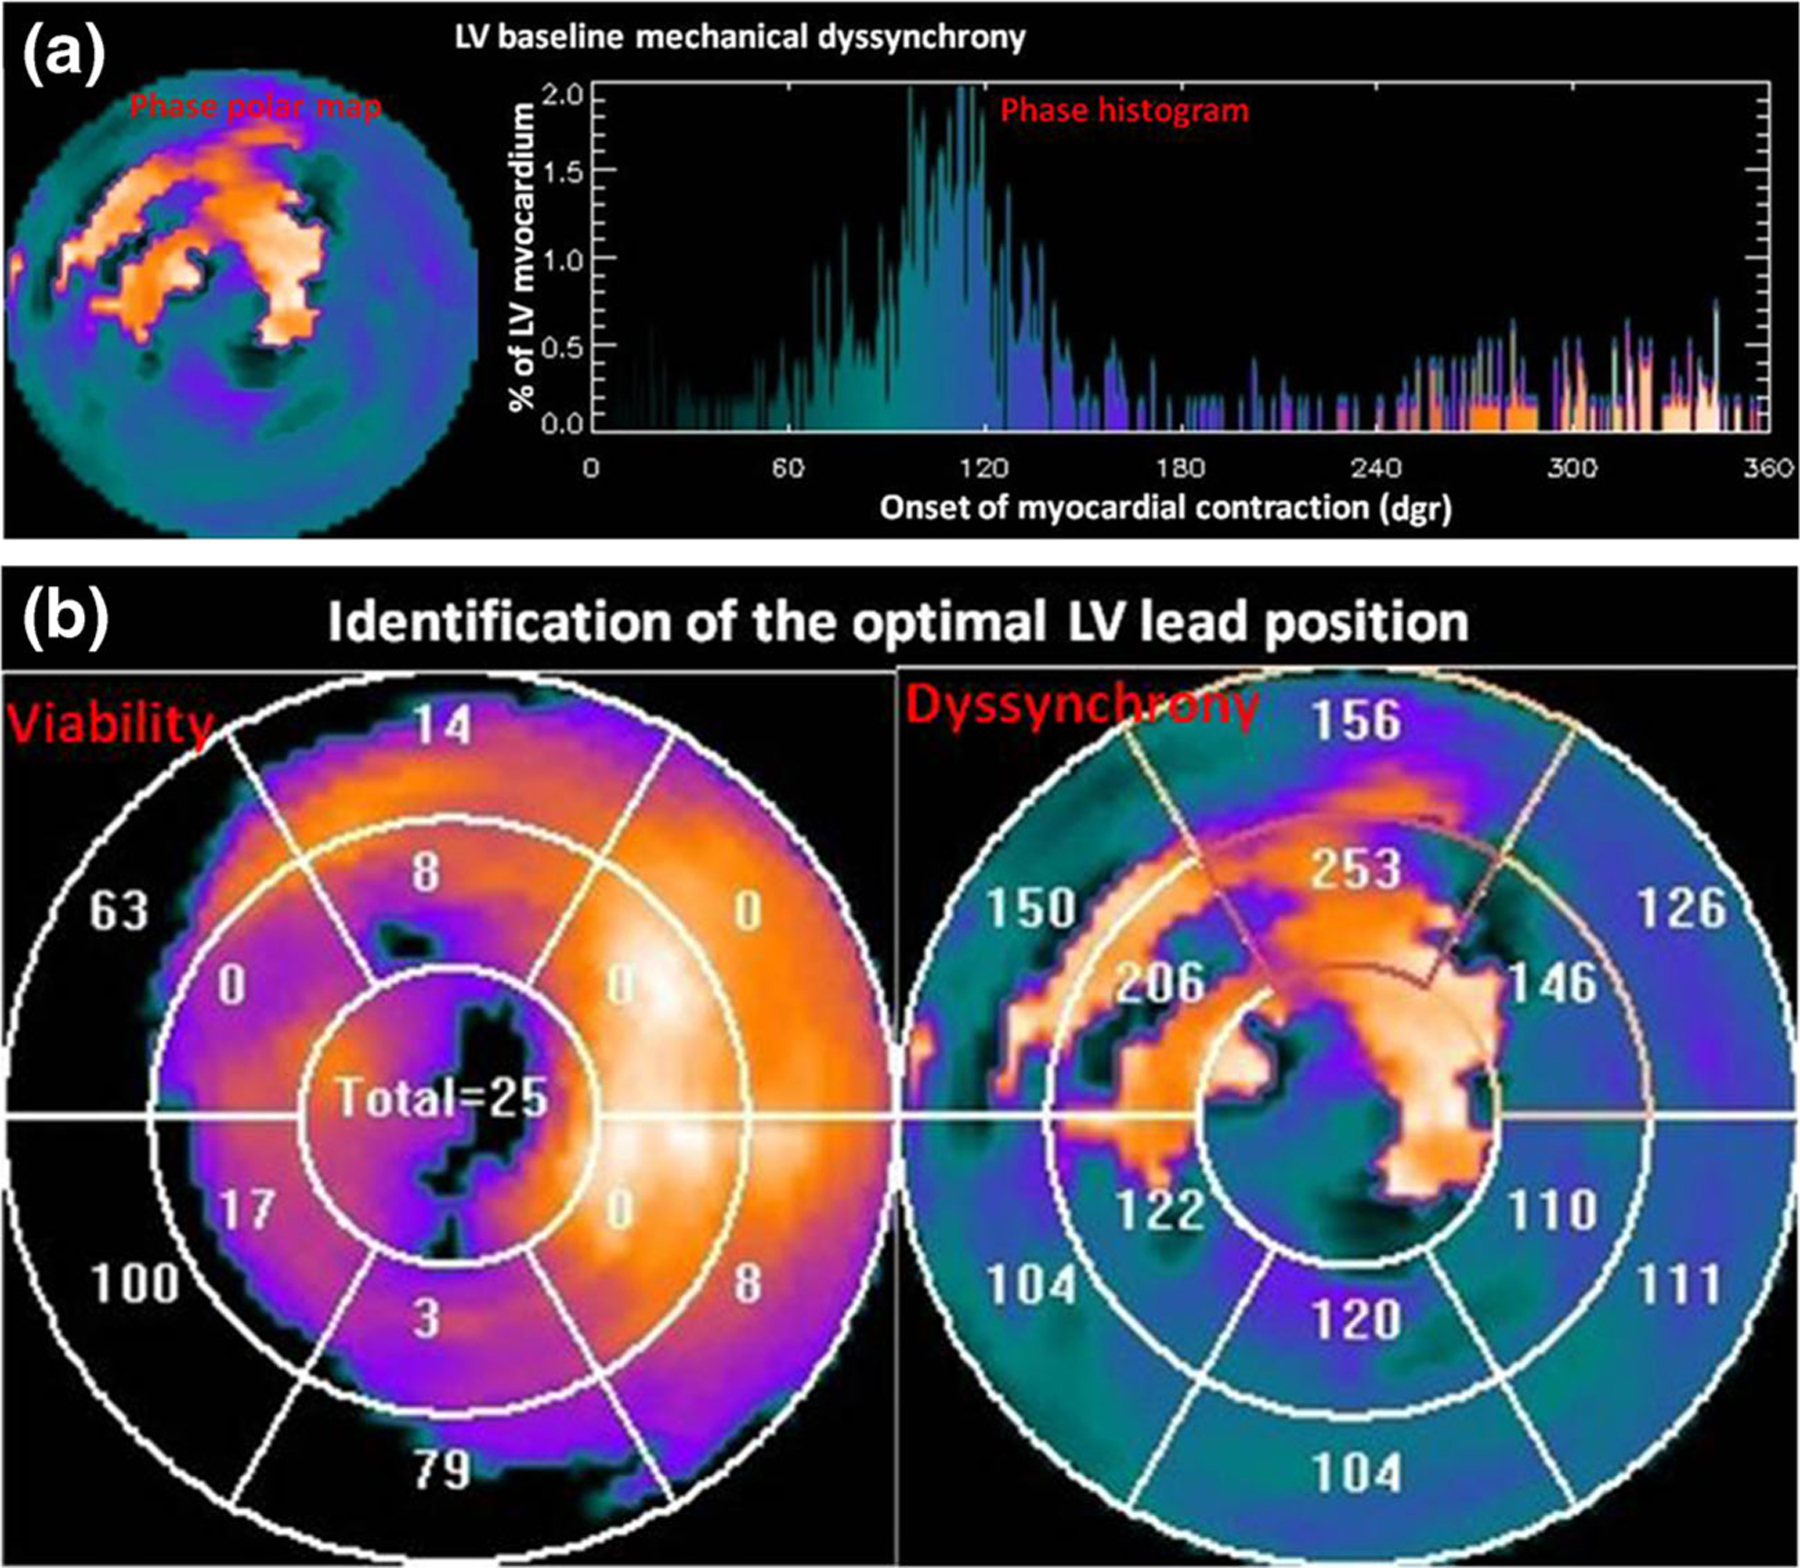
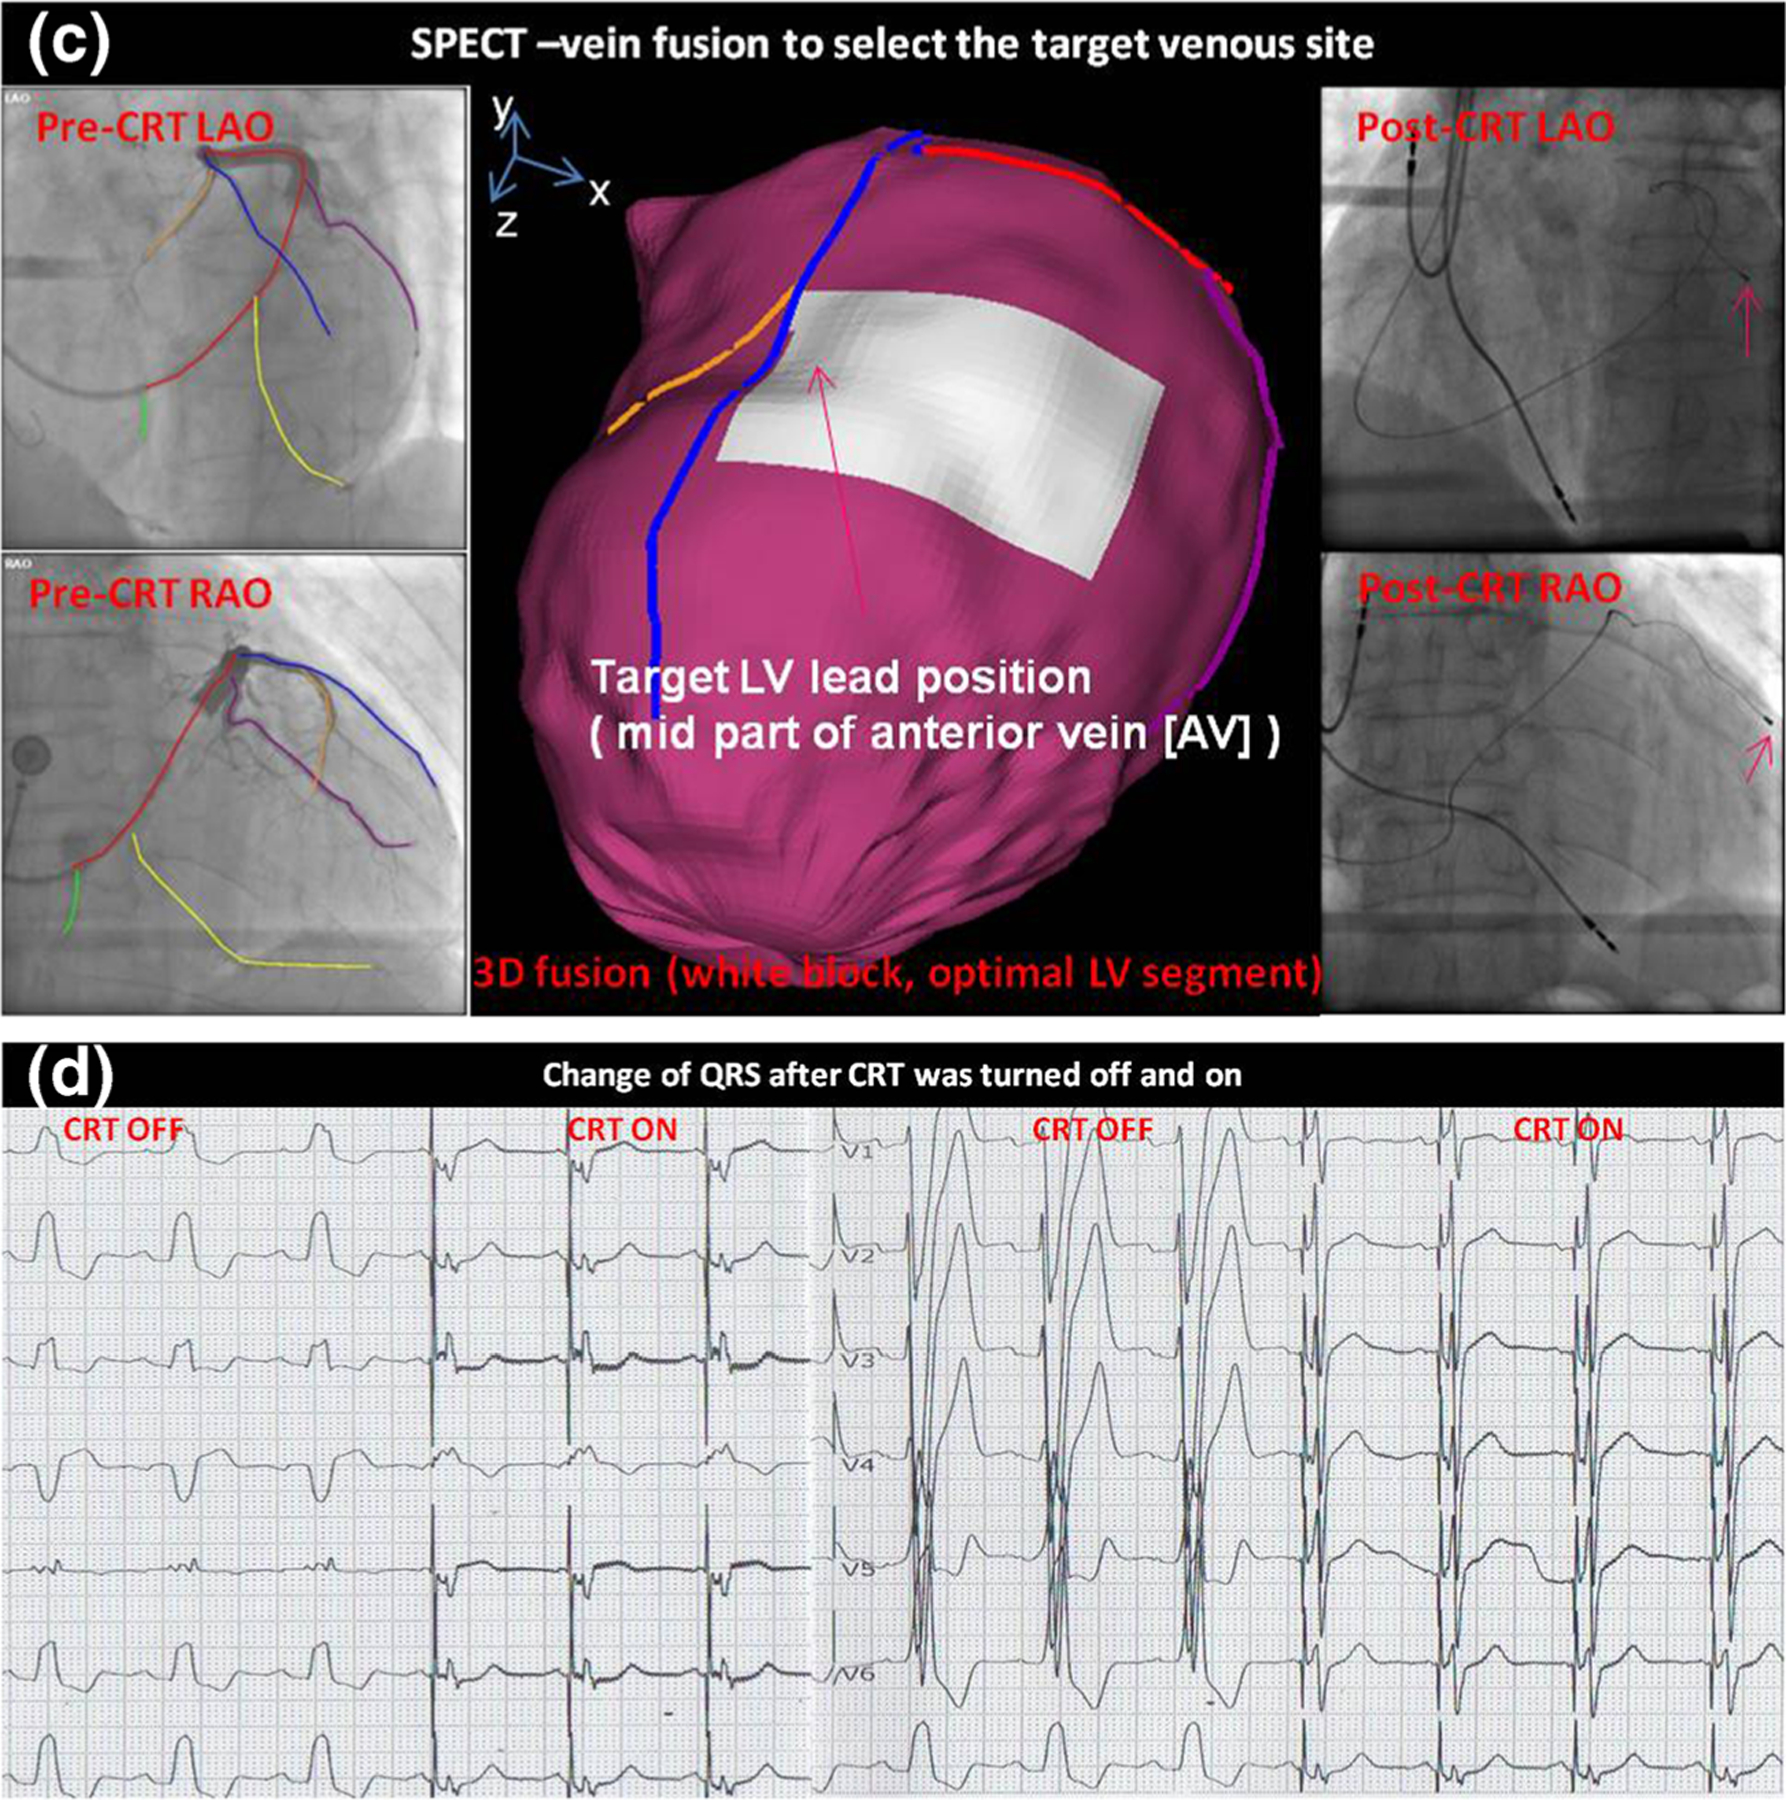
Patient example of SPECT-guided CRT LV lead placement. a LV baseline mechanical dyssynchrony, measure from gated SPECT. b Identification of the optimal LV lead position. The optimal LV lead position is the segment with viable tissues (viability score >50) and at the site of the latest contraction. c 3D SPECT-vein fusion to select the target venous site for CRT procedural planning. The target venous site was the middle part of the anterior vein, and the LV lead was successfully placed to the target venous site as shown in the post-CRT fluoroscopy images. d QRS changed when CRT was turned off and on. QRS duration was significantly narrowed when CRT device was turned on. (Figure modified with permission from [85•])
Before CRT implantation, LV myocardial viability and mechanical dyssynchrony were measured from gated SPECT images using the integrated toolkit. This patient had a PSD of 76.0 in the baseline LV global dyssynchrony study (Fig. 3a), suggesting that there would be a high likelihood to respond to CRT. The optimal LV lead position was identified from the polar maps of myocardial viability and contraction onset. Regional scar burden and contraction delay were rendered as the segments on the electrophysiological 13-segmentational model. The viable segment with the maximum contraction delay was identified as the optimal LV lead position by the software toolkit, which was the middle anterior myocardial wall.
During CRT implantation, dual-view fluoroscopy venograms were acquired and input into the SPECT-vein fusion tool, which was loaded in a computer in the cath lab. The major LV veins were manually drawn on the venograms. Subsequently, the fusion tool automatically reconstructed 3D venous anatomy and generated the 3D navigation map with both color-rendered myocardial surface and veins. The target LV venous site was selected from the navigation map. As shown in Fig. 3, it was the middle anterior vein. Guided by this imagery, the electrophysiologist successfully placed the LV lead to the target venous site, as shown in the post-CRT fluoroscopy.
After CRT implantation, the QRS duration of this patient was immediately and significantly narrowed (from 168 to 140 ms) after the CRT device was turned on. From baseline to 1-month follow-up, LV diastolic diameter of this patient reduced from 64 to 53 mm measured by echocardiography, and the LVEF increased from 32 to 57 %. It clearly confirmed that the image-guided LV lead placement resulted in a super response to CRT.
Challenges and Future of Nuclear Imaging in CRT
Technical Challenges
The low spatial resolution and counts of the SPECT MPI images remains a limitation. PET imaging is performed with higher tracer counts, better spatial resolution, and lower radiation exposure, solving the problem to a great extent [40]. However, there are limited data on dyssynchrony or CRT response using PET images.
The radiation burden with serial scans when assessing LV remodeling and improvement in mechanical dyssynchrony could be a concern in patients with heart failure, although particularly in older patients, the minor radiation risk is mitigated by the potential benefit. The inability to visualize coronary venous anatomy from PET/SPECT can also influence its clinical application. The fusion of SPECT-CT imaging [84] or SPECT-vein [85•] could address this issue.
Large Randomized Clinical Trials
The number of retrospective clinical studies to evaluate nuclear image-guided therapy for CRT is still limited. Moreover, although a large prospective trial is underway (VISION-CRT [82]), results have not been reported. The preliminary results from this new technique are promising, but prospective validation by many single-center studies and large randomized multi-center trials are still needed in order to impact changes in CRT guidelines.
Conclusions
Nuclear image-guided CRT implantation has shown great potential in clinical studies. It has high repeatability and reproducibility to identify the optimal LV lead positions. Three-dimensional fusion to integrate LV myocardial surface on nuclear images with coronary veins on fluoroscopy venograms is technically accurately and clinically applicable to select the target LV venous site for procedural planning. All these techniques, once validated, will significantly impact the current clinical practice.
Supplementary Material
Acknowledgments
Dr. Zhou’s work was supported in part by an AHA grant (15POST22690035, PI: Weihua Zhou, PhD) and the University of Southern Mississippi New Faculty Start-up Grant. Dr. Garcia receives royalties from the sales of the Emory Cardiac Toolbox cited in this article. The terms of this arrangement have been reviewed and approved by Emory University in accordance with it is conflict of interest practice.
Footnotes
This article is part of the Topical Collection on Nuclear Cardiology
Electronic supplementary material The online version of this article (doi:10.1007/s11886-015-0687-4) contains supplementary material, which is available to authorized users.
Compliance with Ethical Standards
Conflict of Interest Weihua Zhou declares no conflict of interest.
Ernest V. Garcia Dr. Garcia receives royalties from the sales of the Emory Cardiac Toolbox cited in this article. The terms of this arrangement have been reviewed and approved by the Emory University in accordance with it is conflict of interest practice.
Human and Animal Rights and Informed Consent This article does not contain any studies with human or animal subjects performed by any of the authors.
References
Papers of particular interest, published recently, have been highlighted as:
• Of importance
- 1.Heart disease and stroke statistics—2013 update: a report from the American Heart Association. Circulation 2013;127:e6–e245 [DOI] [PMC free article] [PubMed] [Google Scholar]
- 2.McAlister FA, Ezekowitz J, Dryden DM, et al. Cardiac resynchronization therapy and implantable cardiac defibrillators in left ventricular systolic dysfunction. Evid Rep Technol Assess (Full Rep). 2007;152:1–199. [PMC free article] [PubMed] [Google Scholar]
- 3.Lozano I, Bocchiardo M, Achtelik M, et al. Impact of biventricular pacing on mortality in a randomized crossover study of patients with heart failure and ventricular arrhythmias. Pacing Clin Electrophysiol. 2000;23:1711–2. [DOI] [PubMed] [Google Scholar]
- 4.Cazeau S, Leclercq C, Lavergne T, et al. Effects of multisite biventricular pacing in patients with heart failure and intraventricular conduction delay. N Engl J Med. 2001;344:873–80. [DOI] [PubMed] [Google Scholar]
- 5.Auricchio A, Stellbrink C, Sack S, et al. Long-term clinical effect of hemodynamically optimized cardiac resynchronization therapy in patients with heart failure and ventricular conduction delay. J Am Coll Cardiol. 2002;39:2026–33. [DOI] [PubMed] [Google Scholar]
- 6.Abraham WT, Fisher WG, Smith AL, et al. Cardiac resynchronization in chronic heart failure. N Engl J Med. 2002;346:1845–53. [DOI] [PubMed] [Google Scholar]
- 7.Young JB, Abraham WT, Smith AL, et al. Combined cardiac resynchronization and implantable cardioversion defibrillation in advanced chronic heart failure: the MIRACLE ICD Trial. JAMA. 2003;289:2685–94. [DOI] [PubMed] [Google Scholar]
- 8.Auricchio A, Stellbrink C, Butter C, et al. Clinical efficacy of cardiac resynchronization therapy using left ventricular pacing in heart failure patients stratified by severity of ventricular conduction delay. J Am Coll Cardiol. 2003;42:2109–16. [DOI] [PubMed] [Google Scholar]
- 9.Bristow MR, Saxon LA, Boehmer J, et al. Cardiac-resynchronization therapy with or without an implantable defibrillator in advanced chronic heart failure. N Engl J Med. 2004;350:2140–50. [DOI] [PubMed] [Google Scholar]
- 10.Cleland JG, Daubert JC, Erdmann E, et al. The effect of cardiac resynchronization on morbidity and mortality in heart failure. N Engl J Med. 2005;352:1539–49. [DOI] [PubMed] [Google Scholar]
- 11.2012 ACCF/AHA/HRS focused update incorporated into the ACCF/AHA/HRS 2008 guidelines for device-based therapy of cardiac rhythm abnormalities: a report of the American College of Cardiology Foundation/American Heart Association Task Force on Practice Guidelines and the Heart Rhythm Society. Circulation 2013;127:e283–352 [DOI] [PubMed] [Google Scholar]
- 12.Schuster P, Faerestrand S, Ohm O. Reverse remodeling of systolic left ventricular contraction pattern by long term cardiac resynchronization therapy: colour Doppler shows resynchronization. Heart. 2004;90: 1411–6. [DOI] [PMC free article] [PubMed] [Google Scholar]
- 13.Verhaert D, Grimm RA, Puntawangkoon C. Long-term reverse remodeling with cardiac resynchronization therapy: results of extended echocardiographic follow-up. J Am Coll Cardiol. 2010;55: 1788–95. [DOI] [PubMed] [Google Scholar]
- 14.Bax JJ, Bleeker GB, Marwick TH, et al. Left ventricular dyssynchrony predicts response and prognosis after cardiac resynchronization therapy. J Am Coll Cardiol. 2004;44:1834–40. [DOI] [PubMed] [Google Scholar]
- 15.Yu CM, Fung JW, Zhang Q, et al. Tissue Doppler imaging is superior to strain rate imaging and postsystolic shortening on the prediction of reverse remodeling in both ischemic and nonischemic heart failure after cardiac resynchronization therapy. Circulation. 2004;110:66–73. [DOI] [PubMed] [Google Scholar]
- 16.Yu CM, Zhang Q, Chan YS, et al. Tissue Doppler velocity is superior to displacement and strain mapping in predicting left ventricular reverse remodeling response after cardiac resynchronization therapy. Heart. 2006;92:1452–6. [DOI] [PMC free article] [PubMed] [Google Scholar]
- 17.Donal E, de Chillou C, Magnin-Poull I, Leclercq C. Imaging in cardiac resynchronization therapy: what does the clinician need? Europace. 2008;10 Suppl 3:iii70–2. [DOI] [PubMed] [Google Scholar]
- 18.Hawkins NM, Petrie MC, MacDonald MR, Hogg KJ, McMurray JJ. Selecting patients for cardiac resynchronization therapy: electrical or mechanical dyssynchrony? Eur Heart J. 2006;27:1270–81. [DOI] [PubMed] [Google Scholar]
- 19.Tanaka H, Nesser HJ, Buck T. Dyssynchrony by speckle-tracking echocardiography and response to cardiac resynchronization therapy: results of the Speckle Tracking and Resynchronization (STAR) study. Eur Heart J. 2010;31:1690–700. [DOI] [PMC free article] [PubMed] [Google Scholar]
- 20.Friehling M, Chen J, Saba S, et al. A prospective pilot study to evaluate the relationship between acute change in left ventricular synchrony after cardiac resynchronization therapy and patient outcome using a single-injection gated SPECT protocol. Circ Cardiovasc Imaging. 2011;4:532–9. [DOI] [PMC free article] [PubMed] [Google Scholar]
- 21. Auger D, Bleeker GB, Bertini M, et al. Effect of cardiac resynchronization therapy in patients without left intraventricular dyssynchrony. Eur Heart J. 2012;33:913–20. • Article concludes that in patients without significant LV dyssynchrony, the induction of LV dyssynchrony after CRT may be related to a less favorable long-term outcome.
- 22.White JA, Yee R, Yuan X, et al. Delayed enhancement magnetic resonance imaging predicts response to cardiac resynchronization therapy in patients with intraventricular dyssynchrony. J Am Coll Cardiol. 2006;48:1953–60. [DOI] [PubMed] [Google Scholar]
- 23.Adelstein EC, Saba S. Scar burden by myocardial perfusion imaging predicts echocardiographic response to cardiac resynchronization therapy in ischemic cardiomyopathy. Am Heart J. 2007;153:105–12. [DOI] [PubMed] [Google Scholar]
- 24.Bleeker GB, Kaandorp TA, Lamb HJ, et al. Effect of postero-lateral scar tissue on clinical and echocardiographic improvement after cardiac resynchronization therapy. Circulation. 2006;113:969–76. [DOI] [PubMed] [Google Scholar]
- 25.Ypenburg C, van Bommel RJ, Delgado V, et al. Optimal left ventricular lead position predicts reverse remodeling and survival after cardiac resynchronization therapy. J Am Coll Cardiol. 2008;52: 1402–9. [DOI] [PubMed] [Google Scholar]
- 26.Murphy RT, Sigurdsson G, Mulamalla S, et al. Tissue synchronization imaging and optimal left ventricular pacing site in cardiac resynchronization therapy. Am J Cardiol. 2006;97:1615–21. [DOI] [PubMed] [Google Scholar]
- 27.Khan FZ, Virdee MS, Palmer CR, et al. Targeted left ventricular lead placement to guide cardiac resynchronization therapy: the TARGET study: a randomized, controlled trial. J Am Coll Cardiol. 2012;59:1509–18. [DOI] [PubMed] [Google Scholar]
- 28.Saba S, Marek J, Schwartzman D, et al. Echocardiography-guided left ventricular lead placement for cardiac resynchronization therapy: results of the Speckle Tracking Assisted Resynchronization Therapy for Electrode Region trial. Circ Heart Fail. 2013;6:427–34. [DOI] [PubMed] [Google Scholar]
- 29.Singh JP, Klein HU, Huang DT, et al. Left ventricular lead position and clinical outcome in the multicenter automatic defibrillator implantation trial—cardiac resynchronization therapy (MADIT-CRT) trial. Circulation. 2011;123:1159–66. [DOI] [PubMed] [Google Scholar]
- 30.Gorcsan J III, Marek JJ, Onishi T. The contemporary role of echocardiography in improving patient response to cardiac resynchronization therapy. Curr Cardiovasc Imaging Rep. 2012;5(6):462–72. [DOI] [PMC free article] [PubMed] [Google Scholar]
- 31. Boogers MJ, Chen J, van Bommel RJ, et al. Optimal left ventricular lead position assessed with phase analysis on gated myocardial perfusion SPECT. Eur J Nucl Med Mol Imaging. 2011;38:230–8. • Article concludes that patients with LV lead position placed concordant to image-guidance showed significant improvement in LV volumes and LV systolic function, whereas patients with a discordant LV lead position showed no significant improvements.
- 32.Khan FZ, Virdee MS, Fynn SP, Dutka DP. Left ventricular lead placement in cardiac resynchronization therapy: where and how? Europace. 2009;11(5):554–61. [DOI] [PubMed] [Google Scholar]
- 33.Becker M, Hoffmann R, Schmitz F. Relation of optimal lead positioning as defined by three-dimensional echocardiography to long-term benefit of cardiac resynchronization. Am J Cardiol. 2007;100(11):1671–6. [DOI] [PubMed] [Google Scholar]
- 34.Kronborg MB, Kim WY, Mortensen PT, Niesen JC. Non-contrast magnetic resonance imaging for guiding left ventricular lead position in cardiac resynchronization therapy. J Interv Card Electrophysiol. 2012;33(1):27–35. [DOI] [PubMed] [Google Scholar]
- 35.Uebleis C, Ulbrich M, Tegtmeyer R, et al. Electrocardiogram-gated 18F-FDG PET/CT hybrid imaging in patients with unsatisfactory response to cardiac resynchronization therapy: initial clinical results. J Nucl Med. 2011;52:67–71. [DOI] [PubMed] [Google Scholar]
- 36.Lehner S, Uebleis C, Schubler F, et al. The amount of viable and dyssynchronous myocardium is associated with response to cardiac resynchronization therapy: initial clinical results using multiparametric ECG-gated [18F] FDG PET. Eur J Nucl Med Mol Imaging. 2013;40:1876–83. [DOI] [PubMed] [Google Scholar]
- 37.Friehling M, Chen J, Saba S, et al. A prospective pilot study to evaluate the relationship between acute change in left ventricular synchrony after cardiac resynchronization therapy and patient outcome using a single-injection gated SPECT protocol. Circ Cardiovasc Imaging. 2011;4:532–9. [DOI] [PMC free article] [PubMed] [Google Scholar]
- 38.Gorcsan J 3rd, Abraham T, Agler DA. Echocardiography for cardiac resynchronization therapy: recommendations for performance and reporting—a report from the American Society of Echocardiography Dyssynchrony Writing Group endorsed by the Heart Rhythm Society. J Am Soc Echocardiogr. 2008;21:191–213. [DOI] [PubMed] [Google Scholar]
- 39.Chen J, Boogers MM, Bax JJ, Soman P, Garcia EV. The use of nuclear imaging for cardiac resynchronization therapy. Curr Cardiol Rep. 2010;12:185–91. [DOI] [PMC free article] [PubMed] [Google Scholar]
- 40.AlJaroudi W, Chen J, Jaber WA, Lloyd SG, Cerqueira MD, Markwick T. Non-echocardiographic imaging in evaluation for cardiac resynchronization therapy. Circ Cardiovasc Imaging. 2011;4: 334–43. [DOI] [PMC free article] [PubMed] [Google Scholar]
- 41.Bax JJ, Delgado V. Myocardial viability as integral part of the diagnostic and therapeutic approach to ischemic heart failure. J Nucl Cardiol. 2015;22(2):229–45. [DOI] [PMC free article] [PubMed] [Google Scholar]
- 42.Bleeker GB, Mollema SA, Holman ER, et al. Left ventricular resynchronization is mandatory for response to cardiac resynchronization therapy: analysis in patients with echocardiographic evidence of left ventricular dyssynchrony at baseline. Circulation. 2007;116:1440–8. [DOI] [PubMed] [Google Scholar]
- 43.Chung ES, Leon AR, Tavazzi L, et al. Results of the Predictors of Response to CRT (PROSPECT) trial. Circulation. 2008;117:2608–16. [DOI] [PubMed] [Google Scholar]
- 44.Jongbloed MR, Lamb HJ, Bax JJ, et al. Noninvasive visualization of the cardiac venous system using multislice computed tomography. J Am Coll Cardiol. 2005;45:749–53. [DOI] [PubMed] [Google Scholar]
- 45.Van de Veire NR, Schuijf JD, De Sutter J, et al. Noninvasive visualization of the cardiac venous system in coronary artery disease patients using 64-slice computed tomography. J Am Coll Cardiol. 2006;48:1832–8. [DOI] [PubMed] [Google Scholar]
- 46.Nieman K, Shapiro MD, Ferencik M, et al. Reperfused myocardial infarction: contrast-enhanced 64-section CT in comparison to MR imaging. Radiology. 2008;247:49–56. [DOI] [PubMed] [Google Scholar]
- 47.Truong QA, Singh JP, Cannon CP, et al. Quantitative analysis of intraventricular dyssynchrony using wall thickness by multidetector computed tomography. JACC Cardiovasc Imaging. 2008;1:772–81. [DOI] [PMC free article] [PubMed] [Google Scholar]
- 48.Leyva F Cardiac resynchronization therapy guided by cardiac magnetic resonance. J Cardiovasc Magn Reson. 2010;12:64. [DOI] [PMC free article] [PubMed] [Google Scholar]
- 49.Chen J, Bax JJ, Henneman MM, Boogers MJ, Garcia EV. Is nuclear imaging a viable alternative technique to assess dyssynchrony? Europace. 2008;10 Suppl 3:iii101–5. [DOI] [PubMed] [Google Scholar]
- 50.Boogers MM, Chen J, Bax JJ. Myocardial perfusion single photon emission computed tomography for the assessment of mechanical dyssynchrony. Curr Opin Cardiol. 2008;23:431–9. [DOI] [PubMed] [Google Scholar]
- 51.Boogers MM, Chen J, Bax JJ. Role of nuclear imaging in cardiac resynchronization therapy. Expert Rev Cardiovasc Ther. 2009;7:65–72. [DOI] [PubMed] [Google Scholar]
- 52.Schwartzman D, Chang I, Michele JJ, Mirotznik MS, Foster KR. Electrical impedance properties of normal and chronically infarcted ventricular myocardium. J Interv Card Electrophysiol. 1999;3:213–24. [DOI] [PubMed] [Google Scholar]
- 53.Reddy VY, Wrobleski D, Houghtaling C, Josephson ME, Ruskin JN. Combined epicardial and endocardial electroanatomic mapping in a porcine model of healed myocardial infarction. Circulation. 2003;107:3236–42. [DOI] [PubMed] [Google Scholar]
- 54.Tedrow U, Maisel WH, Epstein LM, Soejima K, Stevenson WG. Feasibility of adjusting paced left ventricular activation by manipulating stimulus strength. J Am Coll Cardiol. 2004;44:2249–52. [DOI] [PubMed] [Google Scholar]
- 55.Breithardt OA, Stellbrink C, Kramer AP, et al. Echocardiographic quantification of left ventricular asynchrony predicts an acute hemodynamic benefit of cardiac resynchronization therapy. J Am Coll Cardiol. 2002;40:536–45. [DOI] [PubMed] [Google Scholar]
- 56.Gibbons RJ, Verani MS, Behrenbeck T, et al. Feasibility of tomographic technetium-99m-hexakis-2-methylpropyl-isonitrile imaging for the assessment of myocardial area at risk and the effect of acute treatment in myocardial infarction. Circulation. 1989;80:1277–86. [DOI] [PubMed] [Google Scholar]
- 57.O’Connor MD, Gibbons RJ, Juny JE, O’Keefe JH, Ali A. Quantitative myocardial SPECT for infarct sizing: feasibility of a multicenter trial evaluated using a cardiac phantom. J Nucl Med. 1995;36:1130–6. [PubMed] [Google Scholar]
- 58.O’Connor MK, Hammell T, Gibbons RJ. In vitro validation of a simple tomographic technique for estimation of percentage myocardium at risk using methoxyisobutyl isonitrile technetium 99m (sestamibi). Eur J Nucl Med. 1990;17:69–76. [DOI] [PubMed] [Google Scholar]
- 59.Medrano R, Lowry RW, Young JB, et al. Assessment of myocardial viability with Tc-99m sestamibi in patients undergoing cardiac transplantation. Circulation. 1996;94:1010–7. [DOI] [PubMed] [Google Scholar]
- 60.Maes AF, Borgers M, Flameng W, et al. Assessment of myocardial viability in chronic coronary artery disease using technetioum-99m sestamibi SPECT. J Am Coll Cardiol. 1997;29:62–8. [DOI] [PubMed] [Google Scholar]
- 61.Dakik HA, Howell JF, Lawrie GM, Espada R, Weibaecher DG. Assessment of myocardial viability with 99m Tc-sestamibi tomography before coronary bypass graft surgery: correlation with histopathology and postoperative improvement in cardiac function. Circulation. 1997;96:2892–8. [DOI] [PubMed] [Google Scholar]
- 62.Riedlbauchova L, Brunken R, Jaber WA, et al. The impact of myocardial viability on the clinical outcome of cardiac resynchronization therapy. J Cardiovasc Electrophysiol. 2009;20:50–7. [DOI] [PubMed] [Google Scholar]
- 63.Bose A, Kandala J, Upadhyay GA, et al. Impact of myocardial viability and left ventricular lead location on clinical outcome in cardiac resynchronization therapy recipients with ischemic cardiomyopathy. J Cardiovasc Electrophysiol. 2014;25:507–13. [DOI] [PubMed] [Google Scholar]
- 64.Ypenburg C, Schalij MJ, Bleeker GB, et al. Impact of viability and scar tissue on response to cardiac resynchronization therapy in ischaemic heart failure patients. Eur Heart J. 2007;28:33–41. [DOI] [PubMed] [Google Scholar]
- 65.Ficaro EP, Lee BC, Kritzman JN, Corbett JR. Corridor4DM: the Michigan method for quantitative nuclear cardiology. J Nucl Cardiol. 2007;14:455–65. [DOI] [PubMed] [Google Scholar]
- 66.Berman DS, Kang X, Gransar H. Quantitative assessment of myocardial perfusion abnormality on SPECT myocardial perfusion imaging is more reproducible than expert visual analysis. J Nucl Cardiol. 2009;16:45–53. [DOI] [PMC free article] [PubMed] [Google Scholar]
- 67.Bleeker GB, Mollema SA, Holman ER, et al. Left ventricular resynchronization is mandatory for response to cardiac resynchronization therapy: analysis in patients with echocardiographic evidence of left ventricular dyssynchrony at baseline. Circulation. 2007;116:1440–8. [DOI] [PubMed] [Google Scholar]
- 68.Chen J, Garcia EV, Folks RD, et al. Onset of left ventricular mechanical contraction as determined by phase analysis of ECG-gated myocardial perfusion SPECT imaging: development of a diagnostic tool for assessment of cardiac mechanical dyssynchrony. J Nucl Cardiol. 2005;12:687–95. [DOI] [PubMed] [Google Scholar]
- 69.Trimble MA, Borges-Neto S, Smallheiser S, et al. Evaluation of left ventricular mechanical dyssynchrony as determined by phase analysis of ECG-gated SPECT myocardial perfusion imaging in patients with left ventricular dysfunction and conduction disturbances. J Nucl Cardiol. 2007;14:298–307. [DOI] [PubMed] [Google Scholar]
- 70.Trimble MA, Borges-Neto S, Honeycutt EF, et al. Evaluation of mechanical dyssynchrony and myocardial perfusion using phase analysis of gated SPECT imaging in patients with left ventricular dysfunction. J Nucl Cardiol. 2008;15:663–70. [DOI] [PMC free article] [PubMed] [Google Scholar]
- 71.Chen J, Faber TL, Cooke CD, Garcia EV. Temporal resolution of multiharmonic phase analysis of ECG-gated myocardial perfusion SPECT studies. J Nucl Cardiol. 2008;15:383–91. [DOI] [PMC free article] [PubMed] [Google Scholar]
- 72.Trimble MA, Velazquez EJ, Adams GL, et al. Repeatability and reproducibility of phase analysis of gated single-photon emission computed tomography myocardial perfusion imaging used to quantify cardiac dyssynchrony. Nucl Med Commun. 2008;29:374–81. [DOI] [PMC free article] [PubMed] [Google Scholar]
- 73.Lin X, Xu H, Zhao X, et al. Repeatability of left ventricular dyssynchrony and function parameters in serial gated myocardial perfusion SPECT studies. J Nucl Cardiol. 2010;17:811–6. [DOI] [PMC free article] [PubMed] [Google Scholar]
- 74.Pazhenkottil AP, Buechel RR, Herzog BA, et al. Ultrafast assessment of left ventricular dyssynchrony from nuclear myocardial perfusion imaging on a new high-speed gamma camera. Eur J Nucl Med Mol Imaging. 2010;37:2086–92. [DOI] [PubMed] [Google Scholar]
- 75.Aljaroudi W, Koneru J, Heo J, Iskandrian AE. Impact of ischemia on left ventricular dyssynchrony by phase analysis of gated single photon emission computed tomography myocardial perfusion imaging. J Nucl Cardiol. 2011;18:36–42. [DOI] [PubMed] [Google Scholar]
- 76.AlJaroudi W, Iqbal F, Heo J, Iskandrian AE. Relation between heart rate and left ventricular mechanical dyssynchrony in patients with end-stage renal disease. Am J Cardiol. 2011;107:1235–40. [DOI] [PubMed] [Google Scholar]
- 77.Cheung A, Zhou Y, Faber TL, Garcia EV, Zhu L, Chen J. The performance of phase analysis of gated SPECT myocardial perfusion imaging in the presence of perfusion defects: a simulation study. J Nucl Cardiol. 2012;19:500–6. [DOI] [PMC free article] [PubMed] [Google Scholar]
- 78.Henneman MM, Chen J, Ypenburg C, et al. Phase analysis of gated myocardial perfusion SPECT compared to tissue Doppler imaging for the assessment of left ventricular dyssynchrony. J Am Coll Cardiol. 2007;49:1708–14. [DOI] [PubMed] [Google Scholar]
- 79.Marsan NA, Henneman MM, Chen J, et al. Left ventricular dyssynchrony assessed by two 3-dimensional imaging modalities: phase analysis of gated myocardial perfusion SPECT and tri-plane tissue Doppler imaging. Eur J Nucl Med Mol Imaging. 2008;35: 166–73. [DOI] [PMC free article] [PubMed] [Google Scholar]
- 80.Samad Z, Atchley AE, Trimble MA, et al. Prevalence and predictors of mechanical dyssynchrony as defined by phase analysis in patients with left ventricular dysfunction undergoing gated SPECT myocardial perfusion imaging. J Nucl Cardiol. 2011;18:24–30. [DOI] [PMC free article] [PubMed] [Google Scholar]
- 81.Henneman MM, Chen J, Dibbets-Schneider P, et al. Can LV dyssynchrony as assessed with phase analysis on gated myocardial perfusion SPECT predict response to CRT? J Nucl Med. 2007;48: 1104–11. [DOI] [PubMed] [Google Scholar]
- 82.IAEA-VISION CRT. Nuclear Cardiology in Congestive Heart Failure Value of Intraventricular Synchronism Assessment by Gated-SPECT Myocardial Perfusion Imaging in the Management of Heart Failure Patients Submitted to Cardiac Resynchronization Therapy. IAEA annual report; 2013, additional annex information. [Google Scholar]
- 83.Dekker AL, Phelps B, Dijkman B. Epicardial left ventricular lead placement for cardiac resynchronization therapy: optimal pace site selection with pressure-volume loops. J Thorac Cardiovasc Surg. 2004;127:1641–7. [DOI] [PubMed] [Google Scholar]
- 84.Sommer A, Kronborg MB, Poulsen SH, et al. Empiric versus imaging guided left ventricular lead placement in cardiac resynchronization therapy (ImagingCRT): study protocol for a randomized controlled trial. Trials. 2013;14:113. doi: 10.1186/1745-6215-14-113. [DOI] [PMC free article] [PubMed] [Google Scholar]
- 85. Zhou W, Hou X, Piccinelli M, et al. 3D fusion of LV venous anatomy on fluoroscopy venograms with epicardial surface on SPECT myocardial perfusion images for guiding CRT LV lead placement. JACC Cardiovasc Imaging. 2014;7:1239–48. • Article describes image guided method for accurate CRT LV lead placement.
Associated Data
This section collects any data citations, data availability statements, or supplementary materials included in this article.